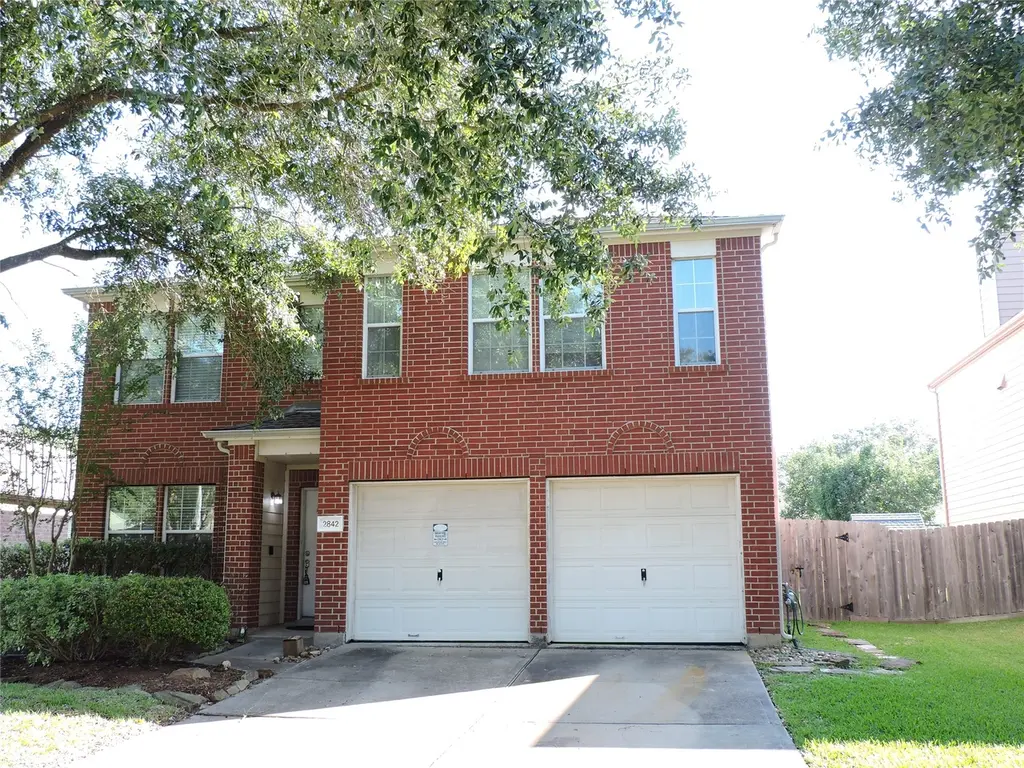
2842 Sandberry Dr
Houston, TX 77345
$293,500C-
4 bd · 2.5 ba ·
3,024 sqft ·
Built 2003
· SingleFamily
· Pending
· 27 DOM
Cashflow @ list (25.0% down · 7.5%)
Estimated rent
$2,893/mo
Mortgage (P&I)
−$1,539
Tax + insurance
−$750
HOA
−$37
Vac / Maint / Mgmt
−$607
Net cashflow
$-41/mo
Annual
$-488/yr
Cap rate
6.13%
Cash-on-cash
-0.59%
DSCR
0.97
1% rule
0.99%
Cash to close
$82,180
Investor read
- This is a 4-bed/2.5-bath single-family listed at $294k.
- At list price, monthly cash flow is $-41 ($-488/yr) — negative.
- To cash-flow at today's rent, offer at most $286k (2.4% below list).
- To meet the 1% rule (rent ≥ 1% of price), the offer needs to be $289k (1.4% below list).
- It's been on market 27 days — a 2% lower offer ($289k) is reasonable based on typical stale-listing flexibility.
- Recommended offer: $286k (2.4% below list) — sets the bar for cash-flow.
- In year one you build about $3k of equity ($2k loan paydown + $1k appreciation (0.5% local appreciation)).
- Location reads 74/100 on livability (#184 in TX, #4,771 nationally) — a middle-class / working-renter tenant base. Strengths: amenities A+, cost of living A+, housing A+; Watch: crime F.
- Humble ISD (urban): math 38% / reading 44% proficiency, ranked #262 of 826 in TX (top 32%) — families likely to look elsewhere, expect single-tenant / working-renter base with shorter leases.
- Zoned schools: Hidden Hollow El (math 46% / reading 53%, grade D, #865 of 4,322 statewide, top 21%, 506 students, 35% FRL); Creekwood Middle (math 49% / reading 50%, grade C, #356 of 1,662 statewide, top 23%, 1,149 students, 21% FRL); Kingwood H S (math 60% / reading 71%, grade B, #193 of 1,632 statewide, top 12%, 2,898 students, 16% FRL).
- Zoned-school proficiency averages 55% at this address vs 41% district-wide (+14 pts) — the actual schools serving this property are materially stronger than the Humble ISD average implies; a family-tenant draw the district grade alone would hide.
- Watch-outs: property tax is 2.6% of price.
- Market conditions: 184 active listings in the ZIP; 9 comparable units currently listed for rent nearby; rentals at typical pace (median 17d on market — plan ~3-4 weeks tenant-placement turnaround); 44% of comp listings sitting > 30 days — soft ceiling on asking rent; high-income renter base; 29,883 units permitted in Harris County in 2024 (8,621 in 5+ unit buildings).
- Harris County population projected at +47% by 2050 — long-run rental-demand tailwind backs the buy-and-hold thesis.
- 5 sale attempts since 14y ago with the ask held roughly flat each time — persistent listings suggest the price (not the market) is what's stuck; bring a comps-based counter.
- By year 9, paydown + projected appreciation supports a ~$34k cash-out refi (75% LTV) — recoverable capital for the next deal without selling this one.
- Climate carrying-cost: severe wind risk, 99% chance of damaging wind over 30y; extreme-heat days projected 7→25/yr by 2055 (HVAC capex compounding) — expect insurance premiums to compound above CPI over the hold.
- Cap rate 6.1% vs local median 3.2% in Houston — top-decile yield for the area; either an underpriced asset or a hidden risk that comps aren't pricing in. Stress-test before assuming the spread holds.
Questions for listing agent
- What do current leases actually rent for vs. the listed asking? Can we see a recent rent roll and the last 12 months of T-12 income?
- Property tax is high relative to price — has the assessment been appealed recently, and will the sale trigger a re-assessment?
- What does the HOA fee cover, when was the last increase, and are there any pending special assessments or reserve-fund shortfalls?
- Is there a deadline driving the sale (1031 exchange, divorce, estate, relocation)? That informs how much negotiation room exists.
- Schools are D-rated, which usually means shorter tenancies and higher turnover. Who's the typical renter profile here, and what's been the actual vacancy rate?
- Crime grade is F in this area — have there been break-ins, vandalism, or insurance claims at this property in the last 3 years? What carrier currently insures it and at what premium?
- What's the average days-on-market for RENTAL listings here right now (not sales)? A rising rental-DOM trend means longer vacancies and softer asking-rent achievability than the comps imply.
- What's the recent tenant-quality profile in this submarket — average credit score on applications, eviction rate, late-payment / NSF rate, and stable-employment percentage? A property-management company in the area should have these aggregated.
CashFlowRE · CFR-FXG2NF61AC0ERS
· Data 3 weeks ago
cashflowre.app · 2026-05-29