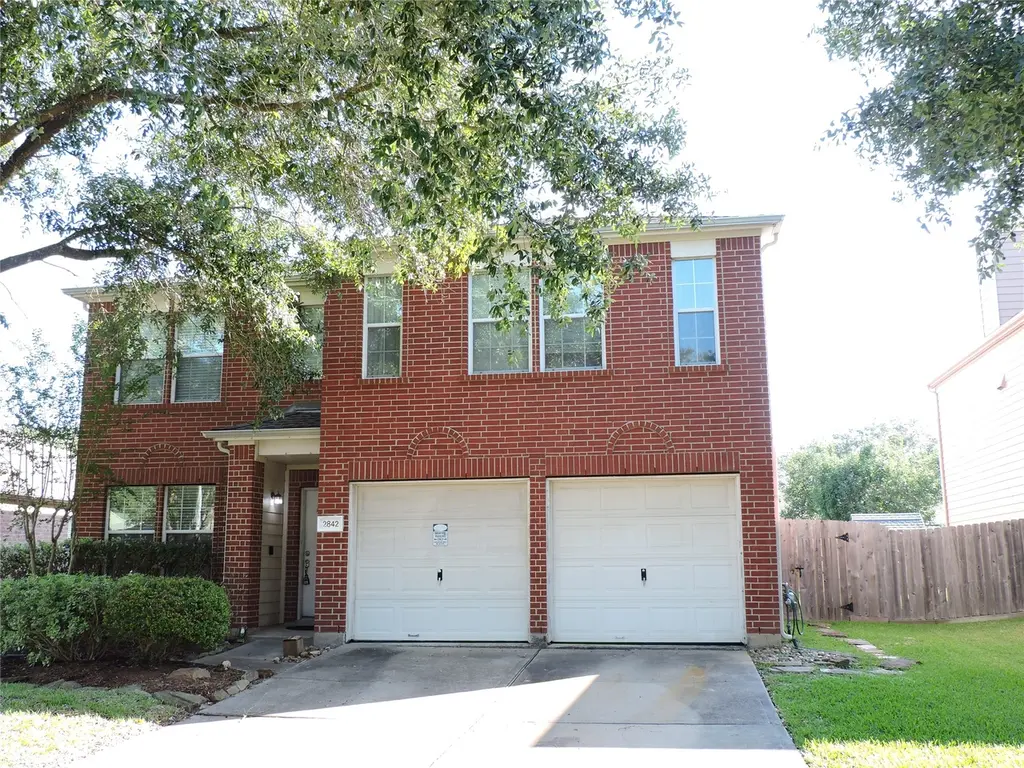
2842 Sandberry Dr · Houston, TX
Flood risk 3/10 · Minor
- FEMA flood zone
- X (unshaded)
- Chance of flooding over 30 yrs
- 0.2%
- Est. flood insurance / yr
- $507 – $1,088
Fire risk 1/10 · Minimal
- Est. fire insurance / yr
- $1,222 – $2,270
Heat risk 9/10 · Severe
- Hot days now (above 111°F)
- 7 days/yr
- Hot days in 30 yrs
- 25 days/yr
Wind risk 8/10 · Major
- Chance of severe wind over 30 yrs
- 99.0%
Air-quality risk 3/10 · Minor
- Unhealthy air days now
- 2 days/yr
- Unhealthy air days in 30 yrs
- 3 days/yr
Risk factors via First Street. Map © Google.
Why this score? — see what drove the C- grade
The composite is a weighted blend of 9 inputs, each scored 0–100. Each bar is that input's sub-score; the figure is the points it added to the 100-point composite (weight × sub-score).
- Cash flow +12.5/30.0
- ARV discount +12.1/15.0
- Appreciation +5.2/10.0
- 1% rule +4.9/10.0
- Schools +3.9/10.0
- DSCR +3.7/10.0
- Livability +3.7/5.0
- Rent growth +2.5/5.0
- Condition / age +2.5/5.0
$293,500
🖨 Deal sheet 📄 Offer letter ✓ Due diligence
Listing remarks MLS
Gorgeous property! This open floor plan features high ceilings that allow lots of natural light. The spacious kitchen offers lots of counter space while allowing access to a cozy living room with a tile fireplace. Upstairs landing makes a perfect game room and large bedrooms have great storage space. This one will go fast, so call today!
Key facts
- Open floor plan
- Spacious kitchen
- Roof replacement
Tags
Property features AI
Finance
- HOA & community: Kingwood Association Management; Annual association fee of $440
Exterior
- Parking: Attached 2-car garage
- Utilities: Public water; Public sewer
- Home design: Residential property; Built in 2003; Slab foundation
- Construction: Brick construction; Composition roof
- Exterior features: Fully fenced yard; Sprinkler/irrigation system
Interior
- Kitchen: Kitchen on the first floor (10 x 12)
- Bedrooms: Primary bedroom on the first floor (18 x 18); Bedroom on the second floor (11 x 14); Bedroom on the second floor (11 x 15); Bedroom on the second floor (12 x 14)
- Bathrooms: 2 full bathrooms; 1 half bathroom
- Heating & cooling: Central gas heating; Central electric air conditioning
- Interior features: Office on the second floor; Game room on the second floor; Living room on the first floor; Dining room on the first floor; Breakfast nook on the first floor
Neighborhood map
What this means for you Summary
Snapshot
- This is a 4-bed/2.5-bath single-family listed at $294k.
Deal economics
- At list price, monthly cash flow is $-41 ($-488/yr) — negative.
- To cash-flow at today's rent, offer at most $286k (2.4% below list).
- To meet the 1% rule (rent ≥ 1% of price), the offer needs to be $289k (1.4% below list).
- Recommended offer: $286k (2.4% below list) — sets the bar for cash-flow.
- Cap rate 6.1% vs local median 3.2% in Houston — top-decile yield for the area; either an underpriced asset or a hidden risk that comps aren't pricing in. Stress-test before assuming the spread holds.
Location & tenants
- Location reads 74/100 on livability (#184 in TX, #4,771 nationally) — a middle-class / working-renter tenant base. Strengths: amenities A+, cost of living A+, housing A+; Watch: crime F.
- Humble ISD (urban): math 38% / reading 44% proficiency, ranked #262 of 826 in TX (top 32%) — families likely to look elsewhere, expect single-tenant / working-renter base with shorter leases.
- Zoned schools: Hidden Hollow El (math 46% / reading 53%, grade D, #865 of 4,322 statewide, top 21%, 506 students, 35% FRL); Creekwood Middle (math 49% / reading 50%, grade C, #356 of 1,662 statewide, top 23%, 1,149 students, 21% FRL); Kingwood H S (math 60% / reading 71%, grade B, #193 of 1,632 statewide, top 12%, 2,898 students, 16% FRL).
- Zoned-school proficiency averages 55% at this address vs 41% district-wide (+14 pts) — the actual schools serving this property are materially stronger than the Humble ISD average implies; a family-tenant draw the district grade alone would hide.
- Market conditions: 184 active listings in the ZIP; 9 comparable units currently listed for rent nearby; rentals at typical pace (median 17d on market — plan ~3-4 weeks tenant-placement turnaround); 44% of comp listings sitting > 30 days — soft ceiling on asking rent; high-income renter base; 29,883 units permitted in Harris County in 2024 (8,621 in 5+ unit buildings).
Forward outlook
- In year one you build about $3k of equity ($2k loan paydown + $1k appreciation (0.5% local appreciation)).
- Harris County population projected at +47% by 2050 — long-run rental-demand tailwind backs the buy-and-hold thesis.
- By year 9, paydown + projected appreciation supports a ~$34k cash-out refi (75% LTV) — recoverable capital for the next deal without selling this one.
Negotiation context
- It's been on market 27 days — a 2% lower offer ($289k) is reasonable based on typical stale-listing flexibility.
- 5 sale attempts since 14y ago with the ask held roughly flat each time — persistent listings suggest the price (not the market) is what's stuck; bring a comps-based counter.
Risks & watch-outs
- Watch-outs: property tax is 2.6% of price.
- Climate carrying-cost: severe wind risk, 99% chance of damaging wind over 30y; extreme-heat days projected 7→25/yr by 2055 (HVAC capex compounding) — expect insurance premiums to compound above CPI over the hold.
Questions for the listing agent
- What do current leases actually rent for vs. the listed asking? Can we see a recent rent roll and the last 12 months of T-12 income?
- Property tax is high relative to price — has the assessment been appealed recently, and will the sale trigger a re-assessment?
- What does the HOA fee cover, when was the last increase, and are there any pending special assessments or reserve-fund shortfalls?
- Is there a deadline driving the sale (1031 exchange, divorce, estate, relocation)? That informs how much negotiation room exists.
- Schools are D-rated, which usually means shorter tenancies and higher turnover. Who's the typical renter profile here, and what's been the actual vacancy rate?
- Crime grade is F in this area — have there been break-ins, vandalism, or insurance claims at this property in the last 3 years? What carrier currently insures it and at what premium?
- What's the average days-on-market for RENTAL listings here right now (not sales)? A rising rental-DOM trend means longer vacancies and softer asking-rent achievability than the comps imply.
- What's the recent tenant-quality profile in this submarket — average credit score on applications, eviction rate, late-payment / NSF rate, and stable-employment percentage? A property-management company in the area should have these aggregated.
- How much new for-sale + rental construction is in the pipeline within 1–3 miles? Heavy new supply typically softens prices + rents 12–24 months out; constrained supply supports both.
Investment metrics
- 1% rule
- 0.99% ✗
- Cap rate
- 6.13%
- Cash-on-cash
- -0.59%
- DSCR
- 0.97
- GRM
- 8.5
CMA / ARV
- ARV (median comp)
- $326,524
- List price
- $293,500
- Delta
- -10.11%
- Verdict
- UNDERPRICED
- Comps
- 20 within 1.0 mi
Show comp detail 12 sales within ~0.75 mi
| Address | Dist | Beds/Ba | Sqft | Sold | Price | $/sf | Match |
|---|---|---|---|---|---|---|---|
| 2907 Heather Lake Ct | 0.23mi | 4/2.5 | 3,048 (+1%) | 1mo | $455,000 | $149 | 87 |
| 3730 Tree Manor Ln | 0.13mi | 4/2.0 | 2,793 (-8%) | 0mo | $395,000 | $141 | 79 |
| 4410 Pine Breeze Dr | 0.27mi | 4/2.5 | 2,848 (-6%) | 0mo | $399,000 | $140 | 77 |
| 3714 Tree Manor Ln | 0.14mi | 4/3.5 | 3,313 (+10%) | 1mo | $469,900 | $142 | 73 |
| 4311 Broadleaf St | 0.34mi | 4/3.5 | 3,147 (+4%) | 2mo | $389,900 | $124 | 72 |
| 2610 Sandy Lodge Ct | 0.51mi | 4/3.5 | 3,018 (-0%) | 2mo | $480,000 | $159 | 70 |
| 2922 Laurel Mist Ct | 0.42mi | 4/3.5 | 2,888 (-4%) | 2mo | $350,000 | $121 | 67 |
| 4019 Echo Mountain Dr | 0.43mi | 4/2.5 | 2,693 (-11%) | 1mo | $359,900 | $134 | 61 |
| 2505 Twisting Pine Ct | 0.61mi | 5/3.5 (+1) | 3,140 (+4%) | 2mo | $429,900 | $137 | 54 |
| 3810 Wildwood Valley Ct | 0.64mi | 5/3.0 (+1) | 2,880 (-5%) | 1mo | $389,900 | $135 | 54 |
| 3318 Misty Alcove Ct | 0.40mi | 3/2.5 (-1) | 2,643 (-13%) | 2mo | $354,900 | $134 | 54 |
| 3527 Whispering Brook Dr | 0.69mi | 4/3.5 | 3,354 (+11%) | 2mo | $425,000 | $127 | 44 |
Match score weights: distance 35% · size 25% · config 20% · recency 20%. Top-matched comps best support the ARV.
Projected returns pro-forma
0.45% appreciation · 3.0% rent growth · sell at horizon
- IRR
- -1.2%
- Equity multiple
- 0.94×
- Total profit
- $-4,649
- Equity at exit
- $91,923
- IRR
- 4.2%
- Equity multiple
- 1.48×
- Total profit
- $39,299
- Equity at exit
- $115,994
Cash invested: $82,180 (down + closing). Projections, not guarantees.
Landlord ↔ Tenant lean methodology
- Overall (STATE)
- 87 Strongly Landlord-Friendly
- State Texas
- 87 Strongly Landlord-Friendly · R+5
- County
- — inherits STATE
- City
- — inherits STATE
ZIP-level market 77345
- Home prices YoY
- 0.2%
- Active inventory
- 184
- Price-to-rent
- 8.5×
Monthly cashflow live
- Estimated rent
- $2,893 high interval (Pro) →
- Mortgage (P&I)
- −$1,539
- Tax from tax record
- −$627 /mo · $7,528/yr
- Insurance
- −$122
- HOA
- −$37
- Vacancy / Maint / Mgmt
- −$607
- Net cashflow
- $-41
Break-even live
UW: 25.0% down · 7.5% · 30yr · 1.5% tax · 5.0% vac · 8.0% maint · 8.0% mgmt
Financing live
Cash to close
- Down payment
- $73,375
- Closing costs
- $8,805
- Reserves months
- —
- Total cash needed
- —
Loan-product check · same deal, 3 products live
Conventional
25% down · 7.5% · 30yr
- Down + closing
- —
- Monthly P&I
- —
- Monthly cashflow
- —
- DSCR
- —
- Eligible?
- —
Personal DTI + credit; lowest rate.
DSCR
20% down · 8.5% · 30yr
- Down + closing
- —
- Monthly P&I
- —
- Monthly cashflow
- —
- DSCR
- —
- Eligible?
- —
No personal income docs; deal must DSCR.
Hard money
10% down · 12.0% · 12mo
- Down + closing
- —
- Monthly P&I
- —
- Monthly cashflow
- —
- DSCR
- —
- Eligible?
- —
Short-term bridge; refi at stabilization.
Rent comps 9 comps
| Address | Beds | Baths | Sqft | Rent | $/sqft | DOM | Units | Dist |
|---|---|---|---|---|---|---|---|---|
| 2934 Apple Forest Ct Kingwood, TX | 4.0 | 3.0 | 3224 | $2,991 | $0.93 | 43d | 1 | 0.37mi |
| 9323 Darby Knoll Way Porter, TX | 4.0 | 2.5 | 2182 | $2,595 | $1.19 | 43d | 1 | 0.59mi |
| 4535 Echo Falls Dr Kingwood, TX | 4.0 | 2.5 | 2184 | $2,145 | $0.98 | 1d | 1 | 0.92mi |
| 3334 Birch Creek Dr Kingwood, TX | 5.0 | 3.5 | 2950 | $2,695 | $0.91 | 43d | 1 | 1.03mi |
| 3311 Pleasant Hollow Ln Porter, TX | 5.0 | 3.5 | 3196 | $3,320 | $1.04 | 16d | 1 | 1.04mi |
| 3102 Hickory Falls Dr Kingwood, TX | 4.0 | 2.5 | 3336 | $2,485 | $0.74 | 2d | 1 | 1.06mi |
| 3619 Maple Glen Dr Kingwood, TX | 4.0 | 2.0 | 2332 | $2,149 | $0.92 | 16d | 1 | 1.10mi |
| 3514 Creek Manor Dr Kingwood, TX | 4.0 | 2.5 | 2274 | $1,995 | $0.88 | 43d | 1 | 1.23mi |
| 5706 Straight Way Kingwood, TX | 4.0 | 2.5 | 2346 | $2,095 | $0.89 | 15d | 1 | 1.42mi |
HOA detail
- Monthly dues
- $37 · $444/yr
Listing history 16 events
-
2026-04-23$293,500 Active 683-char remark
-
2015-07-13soldstatus
-
2015-07-10soldstatus Sold 339-char remark
Show marketing remark (339 chars)
Gorgeous property! This open floor plan features high ceilings that allow lots of natural light. The spacious kitchen offers lots of counter space while allowing access to a cozy living room with a tile fireplace. Upstairs landing makes a perfect game room and large bedrooms have great storage space. This one will go fast, so call today!
-
2015-06-02status Pending 339-char remark
Show marketing remark (339 chars)
Gorgeous property! This open floor plan features high ceilings that allow lots of natural light. The spacious kitchen offers lots of counter space while allowing access to a cozy living room with a tile fireplace. Upstairs landing makes a perfect game room and large bedrooms have great storage space. This one will go fast, so call today!
-
2015-05-24status Option Pending 339-char remark
Show marketing remark (339 chars)
Gorgeous property! This open floor plan features high ceilings that allow lots of natural light. The spacious kitchen offers lots of counter space while allowing access to a cozy living room with a tile fireplace. Upstairs landing makes a perfect game room and large bedrooms have great storage space. This one will go fast, so call today!
-
2015-05-17price $195,000 339-char remark
Show marketing remark (339 chars)
Gorgeous property! This open floor plan features high ceilings that allow lots of natural light. The spacious kitchen offers lots of counter space while allowing access to a cozy living room with a tile fireplace. Upstairs landing makes a perfect game room and large bedrooms have great storage space. This one will go fast, so call today!
-
2015-05-17$190,000 Active 339-char remark
Show marketing remark (339 chars)
Gorgeous property! This open floor plan features high ceilings that allow lots of natural light. The spacious kitchen offers lots of counter space while allowing access to a cozy living room with a tile fireplace. Upstairs landing makes a perfect game room and large bedrooms have great storage space. This one will go fast, so call today!
-
2013-03-26soldstatus
-
2013-03-22soldstatus Sold
Show marketing remark (269 chars)
This stunning entertainers home has a grand epicurean kitchen and large open spaces. A stunning downstairs master retreat and a spacious den with gaslog fireplace add to this wonderful home. Upstairs gameroom and study, built in shelves, sprinkler system and much more!
-
2013-03-04status Pending
Show marketing remark (269 chars)
This stunning entertainers home has a grand epicurean kitchen and large open spaces. A stunning downstairs master retreat and a spacious den with gaslog fireplace add to this wonderful home. Upstairs gameroom and study, built in shelves, sprinkler system and much more!
-
2013-02-22status Option Pending
Show marketing remark (269 chars)
This stunning entertainers home has a grand epicurean kitchen and large open spaces. A stunning downstairs master retreat and a spacious den with gaslog fireplace add to this wonderful home. Upstairs gameroom and study, built in shelves, sprinkler system and much more!
-
2013-02-13$150,000 Active
Show marketing remark (269 chars)
This stunning entertainers home has a grand epicurean kitchen and large open spaces. A stunning downstairs master retreat and a spacious den with gaslog fireplace add to this wonderful home. Upstairs gameroom and study, built in shelves, sprinkler system and much more!
-
2013-01-22historical
-
2013-01-22$154,900 Active
-
2013-01-04historical
-
2012-06-05$157,990 Active
ⓘ Source: listings_history table (triggers on properties + properties_extension) + one-shot
backfill from property_details.listing_events for pre-trigger history.
Tax reassessment forecast TX · Resets to sale price
- Current annual tax
- $7,528 · $627/mo
- Projected year-2 tax
- $7,528 · $627/mo
- Expected delta
- $0/yr ($0/mo · 0.0%)
ⓘ Screening estimate from a state-policy table — verify with the county assessor before closing.
Climate risk First Street
- Flood 3/10 Moderate FEMA zone X (unshaded) · 20% chance over 30 yrs
- Wildfire 1/10 Low
- Heat 9/10 Extreme 7 d/yr ≥111°F today · 25 d/yr by 30 yrs out
- Wind 8/10 Severe 99% chance of damaging wind over 30 yrs
- Air quality 3/10 Moderate 2 unhealthy d/yr today · 3 by 30 yrs out
Nearby sold comps map
Loading sold comps map…
Walkable amenities ~0.75 mi
Loading nearby amenities…
Taxation est. · year 1
- Rental income
- $34,711
- − Mortgage interest
- −$16,441
- − Property taxes
- −$7,528
- − Insurance
- −$1,468
- − Repairs & maintenance
- −$2,777
- − Management
- −$2,777
- − HOA
- −$444
- − Depreciation
- −$8,538
- Taxable loss
- −$5,261
- Est. tax savings @ 24.0%
- +$1,263
- After-tax cash flow
- $775/yr
For passive investors: Depreciation is non-cash, so a rental often shows a tax loss while cash-flowing — sheltering income. Rental losses are passive: they offset passive income freely, and up to $25,000/yr can offset ordinary (W-2) income if you actively participate and your MAGI is under $100k (phasing out to $0 by $150k); unused losses carry forward. On sale, claimed depreciation is recaptured at up to 25%, and gains may owe capital-gains tax (a 1031 exchange can defer both). Figures are a year-1 estimate at your 24.0% rate — not tax advice; consult a CPA.
Schools (NCES district)
- District
- Humble ISD
- NCES district ID
- 4823910
- Math proficiency
- 38% ▼ -11.00%
- Reading proficiency
- 44% ▼ -7.00%
- Median HH income
- $83,946
- Composite
- 38.55/100
- National rank
- #4171
- State rank
- #262 of 826 in TX
Livability — Houston
- Score
- 74/100
- State rank
- #184
- US rank
- #4771
Category grades
Schools grade is shown separately in the Schools card above.
Census & demographics
- Census place
- Houston, TX
- County
- Harris County · 4,702,590 people
- City population
- 3,226,434
- Metro
- Houston-The Woodlands-Sugar Land, TX
- Population (ZIP)
- 27,917
- Household income
- $150,742
- Rent vs Own
- Severe rent burden
- 307.0
Population outlook (Harris County) Hauer SSP2
- Today (2025)
- 5,571,493 people
- By 2030
- 6,089,821 · +9.3%
- By 2040
- 7,142,806 · +28.2%
- By 2050
- 8,185,864 · +46.9%
- By 2075
- 10,574,329 · +89.8%
- By 2100
- 12,109,958 · +117.4%
Race, ethnicity, and origin ACS 2023
- Neighborhood character
- Predominantly White (76%)
- Race & ethnicity
- White 76% Hispanic / Latino 14% Two or more races 10% Asian 3% Black 3%
- Hispanic origin (detail)
- Mexican 10%
- Common ancestry
- Lithuanian 6% Italian 4% Slovak 3%
- Foreign-born
- 8% · Canada, China, Dominican Republic
- Languages at home
- 89% English-only · Spanish 7% Other Indo-European 1% Other Asian/Pacific 1%
Political lean MEDSL · Harris
- 2024 margin
- Lean D (+5.5) · D 52.0% · R 46.4% · Other 1.6%
- 2008→2024 swing
- +3.9pp toward D · 2008: 1.6pp · 2024: 5.5pp
- All cycles
- 2024: D+5.5 2020: D+13.3 2016: D+12.4 2012: D+0.1 2008: D+1.6
Not yet ingested
- Civics
- —
Market trends
- HPI YoY
- ▲ 0.45%
- Current HPI
- 210.6244
- Rent YoY
- —
- Metro
- Houston-The Woodlands-Sugar Land, TX
- State GDP YoY
- ▲ 3.95%
- F500 in state
- 110
Industry mix (Fortune 500 HQ in TX)
| Industry | F500 HQs | Revenue |
|---|---|---|
| Energy | 16 | $1,198B |
|
||
| Technology | 5 | $198B |
|
||
| Engineering / Construction | 4 | $72B |
|
||
| Energy Services | 3 | $60B |
|
||
| Utilities | 3 | $41B |
|
||
| Healthcare | 2 | $330B |
|
||
Price history
+85.8% since first listed18 events — show timeline
- 2026-06-18 Sold (MLS) — HARMLS
- 2026-05-21 Pending — HARMLS
- 2026-04-23 Listed $293,500 HARMLS
- 2015-07-13 Sold (Public Records) — Public Records
- 2015-07-10 Sold (MLS) — HARMLS
- 2015-06-02 Pending — HARMLS
- 2015-05-24 Pending — HARMLS
- 2015-05-17 Price Changed $195,000 HARMLS
- 2015-05-17 Listed $190,000 HARMLS
- 2013-03-26 Sold (Public Records) — Public Records
- 2013-03-22 Sold (MLS) — HARMLS
- 2013-03-04 Pending — HARMLS
- 2013-02-22 Pending — HARMLS
- 2013-02-13 Listed $150,000 HARMLS
- 2013-01-22 Listing Removed — HARMLS
- 2013-01-22 Listed $154,900 HARMLS
- 2013-01-04 Listing Removed — HARMLS
- 2012-06-05 Listed $157,990 HARMLS
Property tax history
+2.3%/yrLatest (2025): $7,528 · +6.1% YoY. Source: county tax records.
Cash-flow waterfall
monthlySold comps — $/sqft
last 12 mo · ≤1 miLoading sold comps…