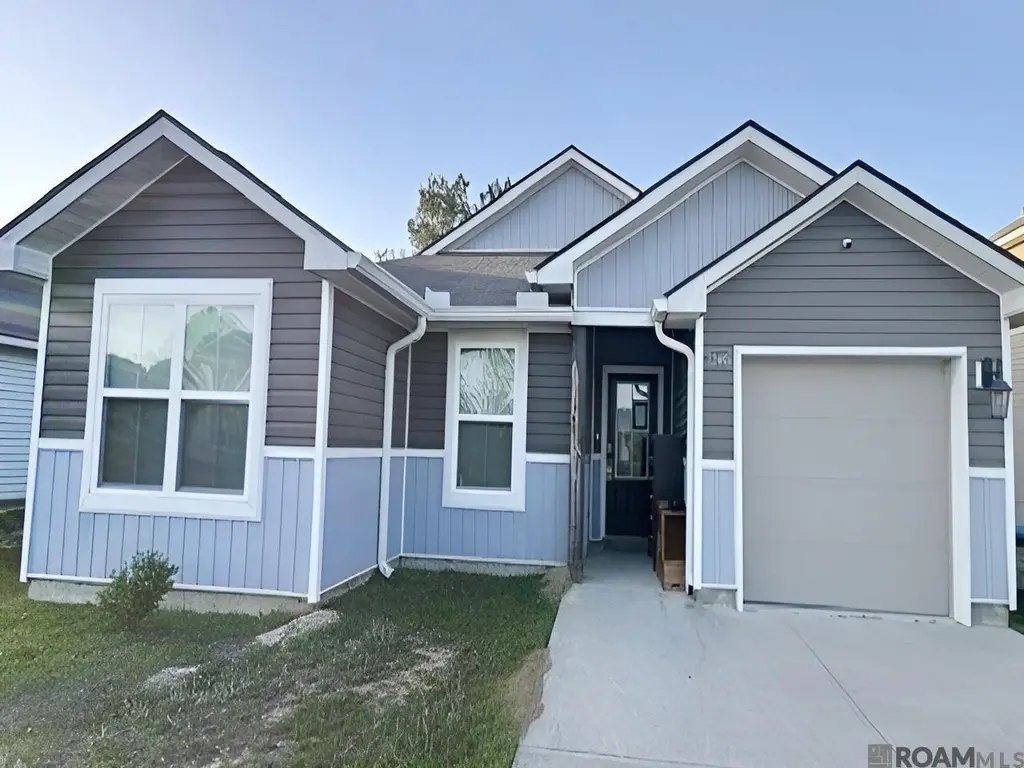
12465 Orchid Ln
Walker, LA 70785
$189,900C
3 bd · 2.0 ba ·
1,557 sqft ·
Built 2021
· SingleFamily
· Pending
· 24 DOM
Cashflow @ list (25.0% down · 7.5%)
Estimated rent
$1,821/mo
Mortgage (P&I)
−$996
Tax + insurance
−$706
HOA
−$28
Vac / Maint / Mgmt
−$382
Net cashflow
$-291/mo
Annual
$-3,495/yr
Cap rate
7.15%
Cash-on-cash
3.05%
DSCR
1.14
1% rule
0.96%
Cash to close
$53,172
Investor read
- This is a 3-bed/2.0-bath single-family listed at $190k. Condition is rated good.
- At list price, monthly cash flow is $-291 ($-3k/yr) — negative.
- To cash-flow at today's rent, offer at most $138k (27.1% below list).
- To meet the 1% rule (rent ≥ 1% of price), the offer needs to be $182k (4.1% below list).
- It's been on market 24 days — a 2% lower offer ($187k) is reasonable based on typical stale-listing flexibility.
- Recommended offer: $138k (27.1% below list) — sets the bar for cash-flow.
- Local home prices are declining (-3.0%/yr); year-one equity from $1k of loan paydown is wiped out by about $6k of value loss. Plan a longer hold.
- Location reads 75/100 on livability (#19 in LA, #3,999 nationally) — a middle-class / working-renter tenant base. Strengths: cost of living A+, housing A+, health & safety A+; Watch: crime F, amenities D-, commute F.
- Livingston Parish (suburban): math 40% / reading 52% proficiency, ranked #13 of 98 in LA (top 13%) — families likely to look elsewhere, expect single-tenant / working-renter base with shorter leases.
- Watch-outs: flood insurance adds $427/mo.
- Market conditions: 254 active listings in the ZIP; 6 comparable units currently listed for rent nearby; rentals at typical pace (median 21d on market — plan ~3-4 weeks tenant-placement turnaround); solid renter incomes; 794 units permitted in Livingston Parish in 2024 (99 in 5+ unit buildings).
- Livingston County population projected at +27% by 2050 — long-run rental-demand tailwind backs the buy-and-hold thesis.
- 6 sale attempts since 5y ago with the ask held roughly flat each time — persistent listings suggest the price (not the market) is what's stuck; bring a comps-based counter.
- Climate carrying-cost: in FEMA flood zone AE (mandatory federal flood insurance); severe wind risk, 99% chance of damaging wind over 30y; extreme-heat days projected 7→20/yr by 2055 (HVAC capex compounding) — expect insurance premiums to compound above CPI over the hold.
- Cap rate 7.1% vs local median 4.8% in Walker — top-decile yield for the area; either an underpriced asset or a hidden risk that comps aren't pricing in. Stress-test before assuming the spread holds.
Questions for listing agent
- What do current leases actually rent for vs. the listed asking? Can we see a recent rent roll and the last 12 months of T-12 income?
- What's the actual annual flood-insurance premium (NFIP or private), and is the property in a SFHA with mandatory coverage?
- What does the HOA fee cover, when was the last increase, and are there any pending special assessments or reserve-fund shortfalls?
- Is there a deadline driving the sale (1031 exchange, divorce, estate, relocation)? That informs how much negotiation room exists.
- Schools are A-rated — typically a magnet for longer-tenancy family renters. What's the average tenant stay here, and is there a school-zone premium baked into asking?
- Crime grade is F in this area — have there been break-ins, vandalism, or insurance claims at this property in the last 3 years? What carrier currently insures it and at what premium?
- What's the average days-on-market for RENTAL listings here right now (not sales)? A rising rental-DOM trend means longer vacancies and softer asking-rent achievability than the comps imply.
- What's the recent tenant-quality profile in this submarket — average credit score on applications, eviction rate, late-payment / NSF rate, and stable-employment percentage? A property-management company in the area should have these aggregated.
CashFlowRE · CFR-FXZZR6BS6EAKVF
· Data 4 weeks ago
cashflowre.app · 2026-05-29