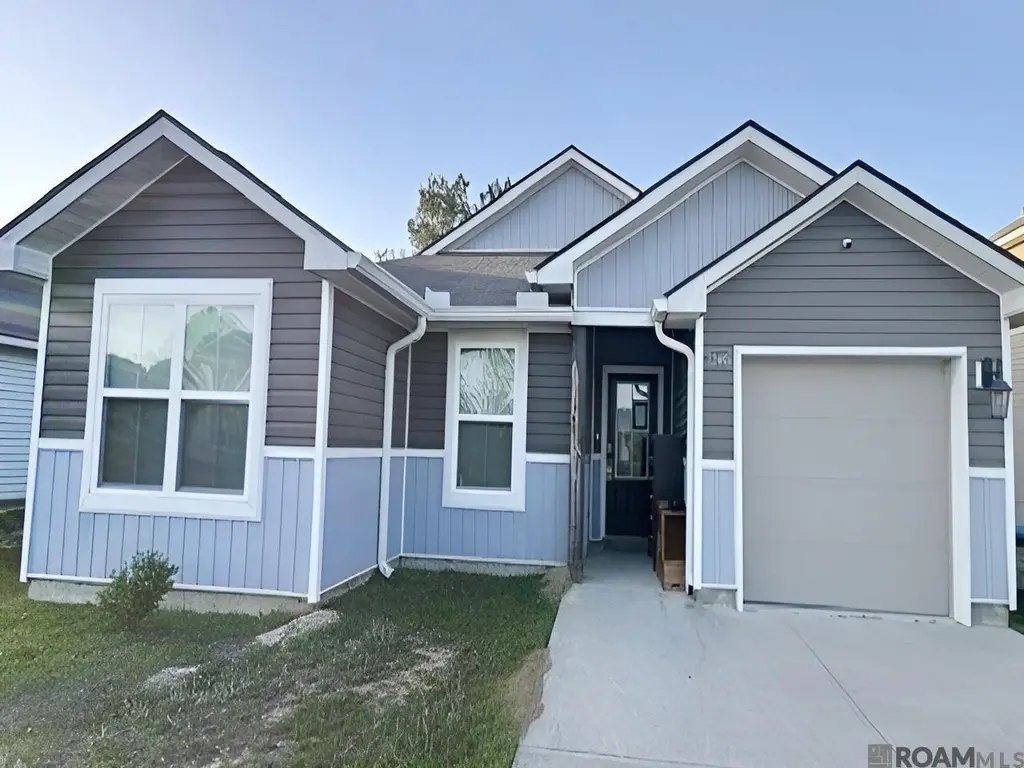
12465 Orchid Ln · Walker, LA
Flood risk 4/10 · Minor
- FEMA flood zone
- AE
- Chance of flooding over 30 yrs
- 0.22%
- Est. flood insurance / yr
- $1,737 – $8,500
Fire risk 3/10 · Minor
- Est. fire insurance / yr
- $1,269 – $2,357
Heat risk 8/10 · Major
- Hot days now (above 108°F)
- 7 days/yr
- Hot days in 30 yrs
- 20 days/yr
Wind risk 9/10 · Severe
- Chance of severe wind over 30 yrs
- 99.0%
Air-quality risk 3/10 · Minor
- Unhealthy air days now
- 3 days/yr
- Unhealthy air days in 30 yrs
- 3 days/yr
Risk factors via First Street. Map © Google.
Why this score? — see what drove the C grade
The composite is a weighted blend of 9 inputs, each scored 0–100. Each bar is that input's sub-score; the figure is the points it added to the 100-point composite (weight × sub-score).
- Cash flow +17.2/30.0
- ARV discount +15.0/15.0
- DSCR +5.4/10.0
- 1% rule +4.6/10.0
- Schools +4.0/10.0
- Condition / age +4.0/5.0
- Livability +3.8/5.0
- Rent growth +2.5/5.0
- Appreciation +0.0/10.0
$189,900
🖨 Deal sheet (PDF) 📄 Offer letter ✓ Due diligence
Listing remarks MLS
Precious 3-bedroom home located in the Walker area in the Foxglove subdivision. Large, open den with lots of natural light. Enjoy the large rear yard and a single, enclosed garage. Measurement not warranted.
Key facts
- Foxglove subdivision
- Large open den
- Large rear yard
Tags
Neighborhood map
What this means for you Summary
Snapshot
- This is a 3-bed/2.0-bath single-family listed at $190k. Condition is rated good.
Deal economics
- At list price, monthly cash flow is $-291 ($-3k/yr) — negative.
- To cash-flow at today's rent, offer at most $138k (27.1% below list).
- To meet the 1% rule (rent ≥ 1% of price), the offer needs to be $182k (4.1% below list).
- Recommended offer: $138k (27.1% below list) — sets the bar for cash-flow.
- Cap rate 7.1% vs local median 4.8% in Walker — top-decile yield for the area; either an underpriced asset or a hidden risk that comps aren't pricing in. Stress-test before assuming the spread holds.
Location & tenants
- Location reads 75/100 on livability (#19 in LA, #3,999 nationally) — a middle-class / working-renter tenant base. Strengths: cost of living A+, housing A+, health & safety A+; Watch: crime F, amenities D-, commute F.
- Livingston Parish (suburban): math 40% / reading 52% proficiency, ranked #13 of 98 in LA (top 13%) — families likely to look elsewhere, expect single-tenant / working-renter base with shorter leases.
- Market conditions: 254 active listings in the ZIP; 6 comparable units currently listed for rent nearby; rentals at typical pace (median 21d on market — plan ~3-4 weeks tenant-placement turnaround); solid renter incomes; 794 units permitted in Livingston Parish in 2024 (99 in 5+ unit buildings).
Forward outlook
- Local home prices are declining (-3.0%/yr); year-one equity from $1k of loan paydown is wiped out by about $6k of value loss. Plan a longer hold.
- Livingston County population projected at +27% by 2050 — long-run rental-demand tailwind backs the buy-and-hold thesis.
Negotiation context
- It's been on market 24 days — a 2% lower offer ($187k) is reasonable based on typical stale-listing flexibility.
- 6 sale attempts since 5y ago with the ask held roughly flat each time — persistent listings suggest the price (not the market) is what's stuck; bring a comps-based counter.
Risks & watch-outs
- Watch-outs: flood insurance adds $427/mo.
- Climate carrying-cost: in FEMA flood zone AE (mandatory federal flood insurance); severe wind risk, 99% chance of damaging wind over 30y; extreme-heat days projected 7→20/yr by 2055 (HVAC capex compounding) — expect insurance premiums to compound above CPI over the hold.
Questions for the listing agent
- What do current leases actually rent for vs. the listed asking? Can we see a recent rent roll and the last 12 months of T-12 income?
- What's the actual annual flood-insurance premium (NFIP or private), and is the property in a SFHA with mandatory coverage?
- What does the HOA fee cover, when was the last increase, and are there any pending special assessments or reserve-fund shortfalls?
- Is there a deadline driving the sale (1031 exchange, divorce, estate, relocation)? That informs how much negotiation room exists.
- Schools are A-rated — typically a magnet for longer-tenancy family renters. What's the average tenant stay here, and is there a school-zone premium baked into asking?
- Crime grade is F in this area — have there been break-ins, vandalism, or insurance claims at this property in the last 3 years? What carrier currently insures it and at what premium?
- What's the average days-on-market for RENTAL listings here right now (not sales)? A rising rental-DOM trend means longer vacancies and softer asking-rent achievability than the comps imply.
- What's the recent tenant-quality profile in this submarket — average credit score on applications, eviction rate, late-payment / NSF rate, and stable-employment percentage? A property-management company in the area should have these aggregated.
- How much new for-sale + rental construction is in the pipeline within 1–3 miles? Heavy new supply typically softens prices + rents 12–24 months out; constrained supply supports both.
Investment metrics
- 1% rule
- 0.96% ✗
- Cap rate
- 7.15%
- Cash-on-cash
- 3.05%
- DSCR
- 1.14
- GRM
- 8.7
CMA / ARV
- ARV (median comp)
- $248,456
- List price
- $189,900
- Delta
- -23.57%
- Verdict
- UNDERPRICED
- Comps
- 20 within 1.0 mi
Show comp detail 11 sales within ~0.75 mi
| Address | Dist | Beds/Ba | Sqft | Sold | Price | $/sf | Match |
|---|---|---|---|---|---|---|---|
| 33383 Hyacinth St | 0.22mi | 4/2.0 (+1) | 1,496 (-4%) | 10mo | $215,000 | $144 | 70 |
| 12308 Creekside Ave | 0.31mi | 3/2.0 | 1,358 (-13%) | 1mo | $228,000 | $168 | 64 |
| 12250 Cottage Hill Dr | 0.38mi | 3/2.0 | 1,378 (-12%) | 12mo | $240,000 | $174 | 53 |
| 12231 Greenbriar Dr | 0.48mi | 3/2.0 | 1,358 (-13%) | 5mo | $225,000 | $166 | 52 |
| 12722 Darby Dr | 0.60mi | 3/2.0 | 1,390 (-11%) | 5mo | $215,000 | $155 | 50 |
| 13155 Hanks Way | 0.74mi | 3/2.0 | 1,601 (+3%) | 13mo | $224,000 | $140 | 50 |
| 12236 Creekside Ave | 0.34mi | 3/2.0 | 1,383 (-11%) | 20mo | $215,000 | $155 | 49 |
| 33667 Fairhaven Ave | 0.36mi | 3/2.0 | 1,388 (-11%) | 21mo | $212,000 | $153 | 48 |
| 12257 Cottage Hill Dr | 0.40mi | 3/2.0 | 1,354 (-13%) | 15mo | $185,000 | $137 | 47 |
| 12741 Darby Dr | 0.55mi | 3/2.0 | 1,345 (-14%) | 14mo | $223,000 | $166 | 40 |
| 33245 Cross Trl | 0.53mi | 3/2.0 | 1,396 (-10%) | 22mo | $223,000 | $160 | 40 |
Match score weights: distance 35% · size 25% · config 20% · recency 20%. Top-matched comps best support the ARV.
Projected returns pro-forma
-3.0% appreciation · 3.0% rent growth · sell at horizon
- IRR
- -27.4%
- Equity multiple
- 0.08×
- Total profit
- $-49,040
- Equity at exit
- $28,315
- IRR
- -24.8%
- Equity multiple
- -0.23×
- Total profit
- $-65,438
- Equity at exit
- $16,419
Cash invested: $53,172 (down + closing). Projections, not guarantees.
Landlord ↔ Tenant lean methodology
- Overall (STATE)
- 90 Strongly Landlord-Friendly
- State Louisiana
- 90 Strongly Landlord-Friendly · R+12
- County
- — inherits STATE
- City
- — inherits STATE
ZIP-level market 70785
- Home prices YoY
- -34.0%
- Active inventory
- 254
- Price-to-rent
- 8.7×
Monthly cashflow live
- Estimated rent
- $1,821 high interval (Pro) →
- Mortgage (P&I)
- −$996
- Tax from tax record
- −$200 /mo · $2,405/yr
- Insurance
- −$79
- Flood insurance flood zone
- −$427 /mo · $5,118/yr
- HOA
- −$28
- Vacancy / Maint / Mgmt
- −$382
- Net cashflow
- $-291
Break-even live
Sensitivity live
| Price | -10% $-184 | -5% $-238 | +0% $-291 | +5% $-345 | +10% $-399 |
|---|---|---|---|---|---|
| Rent | -10% $-435 | -5% $-363 | +0% $-291 | +5% $-219 | +10% $-147 |
| Rate | -1.0pp $-196 | -0.5pp $-243 | base $-291 | +0.5pp $-340 | +1.0pp $-391 |
UW: 25.0% down · 7.5% · 30yr · 1.5% tax · 5.0% vac · 8.0% maint · 8.0% mgmt
Financing live
Cash to close
- Down payment
- $47,475
- Closing costs
- $5,697
- Reserves months
- —
- Total cash needed
- —
Loan-product check · same deal, 3 products live
Conventional
25% down · 7.5% · 30yr
- Down + closing
- —
- Monthly P&I
- —
- Monthly cashflow
- —
- DSCR
- —
- Eligible?
- —
Personal DTI + credit; lowest rate.
DSCR
20% down · 8.5% · 30yr
- Down + closing
- —
- Monthly P&I
- —
- Monthly cashflow
- —
- DSCR
- —
- Eligible?
- —
No personal income docs; deal must DSCR.
Hard money
10% down · 12.0% · 12mo
- Down + closing
- —
- Monthly P&I
- —
- Monthly cashflow
- —
- DSCR
- —
- Eligible?
- —
Short-term bridge; refi at stabilization.
Rent comps 6 comps
| Address | Beds | Baths | Sqft | Rent | $/sqft | DOM | Units | Dist |
|---|---|---|---|---|---|---|---|---|
| 12567 Orchid Ln Walker, LA | 4.0 | 2.0 | 1496 | $1,750 | $1.17 | 20d | 1 | 0.13mi |
| 12567 Orchid Ln Walker, LA | 4.0 | 2.0 | 1496 | $1,750 | $1.17 | 16d | 1 | 0.13mi |
| 12268 Cottage Hill Dr Walker, LA | 3.0 | 2.0 | 1373 | $1,850 | $1.35 | 20d | 1 | 0.38mi |
| 30794 Tanner Ln Walker, LA | 3.0 | 2.0 | 1184 | $1,550 | $1.31 | 25d | 1 | 0.91mi |
| 13340 Isabella Blvd Walker, LA | 4.0 | 2.0 | 1668 | $2,000 | $1.20 | 46d | 1 | 0.97mi |
| 30962 Clearview Ct Denham Springs, LA | 4.0 | 2.0 | 1704 | $1,945 | $1.14 | 20d | 1 | 1.31mi |
HOA detail
- Monthly dues
- $28 · $336/yr
Listing history 11 events
-
2026-05-08status Pending 207-char remark
Show marketing remark (207 chars)
Precious 3-bedroom home located in the Walker area in the Foxglove subdivision. Large, open den with lots of natural light. Enjoy the large rear yard and a single, enclosed garage. Measurement not warranted.
-
2026-05-08status Pending 207-char remark
Show marketing remark (207 chars)
Precious 3-bedroom home located in the Walker area in the Foxglove subdivision. Large, open den with lots of natural light. Enjoy the large rear yard and a single, enclosed garage. Measurement not warranted.
-
2026-04-14$189,900 Active 207-char remark
Show marketing remark (207 chars)
Precious 3-bedroom home located in the Walker area in the Foxglove subdivision. Large, open den with lots of natural light. Enjoy the large rear yard and a single, enclosed garage. Measurement not warranted.
-
2026-04-14$189,900 Active 207-char remark
Show marketing remark (207 chars)
Precious 3-bedroom home located in the Walker area in the Foxglove subdivision. Large, open den with lots of natural light. Enjoy the large rear yard and a single, enclosed garage. Measurement not warranted.
-
2025-12-02$225,000 Active
-
2025-12-02$225,000 Active
-
2021-11-18soldstatus Sold
-
2021-10-22status Pending
-
2021-06-19price $228,225
-
2021-06-07$216,225 Active
-
2021-06-07$228,225
ⓘ Source: listings_history table (triggers on properties + properties_extension) + one-shot
backfill from property_details.listing_events for pre-trigger history.
Tax reassessment forecast LA · Resets to sale price
- Current annual tax
- $2,405 · $200/mo
- Projected year-2 tax
- $2,405 · $200/mo
- Expected delta
- $0/yr ($0/mo · 0.0%)
ⓘ Screening estimate from a state-policy table — verify with the county assessor before closing.
Climate risk First Street
- Flood 4/10 Moderate FEMA zone AE · 22% chance over 30 yrs
- Wildfire 3/10 Moderate
- Heat 8/10 Severe 7 d/yr ≥108°F today · 20 d/yr by 30 yrs out
- Wind 9/10 Extreme 99% chance of damaging wind over 30 yrs
- Air quality 3/10 Moderate 3 unhealthy d/yr today · 3 by 30 yrs out
Nearby sold comps map
Loading sold comps map…
Walkable amenities ~0.75 mi
Loading nearby amenities…
Taxation est. · year 1
- Rental income
- $21,853
- − Mortgage interest
- −$10,637
- − Property taxes
- −$2,405
- − Insurance
- −$6,068
- − Repairs & maintenance
- −$1,748
- − Management
- −$1,748
- − HOA
- −$336
- − Depreciation
- −$5,524
- Taxable loss
- −$6,614
- Est. tax savings @ 24.0%
- +$1,587
- After-tax cash flow
- $-1,908/yr
For passive investors: Depreciation is non-cash, so a rental often shows a tax loss while cash-flowing — sheltering income. Rental losses are passive: they offset passive income freely, and up to $25,000/yr can offset ordinary (W-2) income if you actively participate and your MAGI is under $100k (phasing out to $0 by $150k); unused losses carry forward. On sale, claimed depreciation is recaptured at up to 25%, and gains may owe capital-gains tax (a 1031 exchange can defer both). Figures are a year-1 estimate at your 24.0% rate — not tax advice; consult a CPA.
Condition & rehab AI · 12 photos
This well-maintained single-family home in Walker, LA, offers a good investment opportunity with minimal repairs needed.
Value-add opportunities
- Resale Paint exterior trim — Enhances curb appeal and value
- Rental Clean gutters — Keeps property in good condition for tenants
Renovation cost estimate screening
Value-add ROI direction
- Resale Paint exterior trim — Enhances curb appeal and value ↑
- Rental Clean gutters — Keeps property in good condition for tenants ↑
ⓘ Cost ranges are severity-bucket heuristics (US national rule-of-thumb). Get contractor quotes + a written scope before underwriting a rehab budget.
Schools (NCES district)
- District
- Livingston Parish
- NCES district ID
- 2201020
- Math proficiency
- 40% ▼ -38.00%
- Reading proficiency
- 52% ▼ -32.00%
- Median HH income
- $56,755
- Composite
- 40.07/100
- National rank
- #3811
- State rank
- #13 of 98 in LA
Livability — Walker
- Score
- 75/100
- State rank
- #19
- US rank
- #3999
Category grades
Schools grade is shown separately in the Schools card above.
Census & demographics
- County
- Livingston Parish · 87,496 people
- City population
- 23,921
- Metro
- Baton Rouge, LA
- Population (ZIP)
- 23,921
- Household income
- $89,103
- Rent vs Own
- Severe rent burden
- 343.0
Population outlook (Livingston County) Hauer SSP2
- Today (2025)
- 158,511 people
- By 2030
- 168,241 · +6.1%
- By 2040
- 186,252 · +17.5%
- By 2050
- 201,516 · +27.1%
- By 2075
- 231,217 · +45.9%
- By 2100
- 241,697 · +52.5%
Race, ethnicity, and origin ACS 2023
- Neighborhood character
- Predominantly White (88%)
- Race & ethnicity
- White 88% Black 6% Two or more races 4% Asian 2% Hispanic / Latino 2%
- Common ancestry
- Lithuanian 10% Italian 2% Slovak 2%
- Foreign-born
- 2% · Canada, China, Vietnam
- Languages at home
- 97% English-only · Chinese 1% Spanish 1%
Political lean MEDSL · Livingston
- 2024 margin
- Solid R (+68.5) · D 15.1% · R 83.6% · Other 1.3%
- 2008→2024 swing
- +3.4pp toward D · 2008: -71.9pp · 2024: -68.5pp
- All cycles
- 2024: R+68.5 2020: R+70.0 2016: R+72.5 2012: R+70.4 2008: R+71.9
Not yet ingested
- Civics
- —
Market trends
- HPI YoY
- ▼ -84.92%
- Current HPI
- 164.6373
- Rent YoY
- —
- Metro
- Baton Rouge, LA
- State GDP YoY
- ▲ 3.29%
- F500 in state
- 10
Industry mix (Fortune 500 HQ in LA)
| Industry | F500 HQs | Revenue |
|---|---|---|
| Telecommunications | 2 | $23B |
|
||
| Utilities | 1 | $12B |
|
||
| Wholesale / Distribution | 1 | $5B |
|
||
| Advertising | 1 | $2B |
|
||
Price history
-12.2% since first listed11 events — show timeline
- 2026-05-08 Pending — AcadianaMLS
- 2026-05-08 Pending — GBRMLS
- 2026-04-14 Listed $189,900 GBRMLS
- 2026-04-14 Listed $189,900 AcadianaMLS
- 2025-12-02 Listed $225,000 GBRMLS
- 2025-12-02 Listed $225,000 AcadianaMLS
- 2021-11-18 Sold (MLS) — GBRMLS
- 2021-10-22 Pending — GBRMLS
- 2021-06-19 Price Changed $228,225 GBRMLS
- 2021-06-07 Listed $228,225 AcadianaMLS
- 2021-06-07 Listed $216,225 GBRMLS
Property tax history
+1205.8%/yrLatest (2024): $2,405 · +8.8% YoY. Source: county tax records.
Cash-flow waterfall
monthlySold comps — $/sqft
last 12 mo · ≤1 miLoading sold comps…