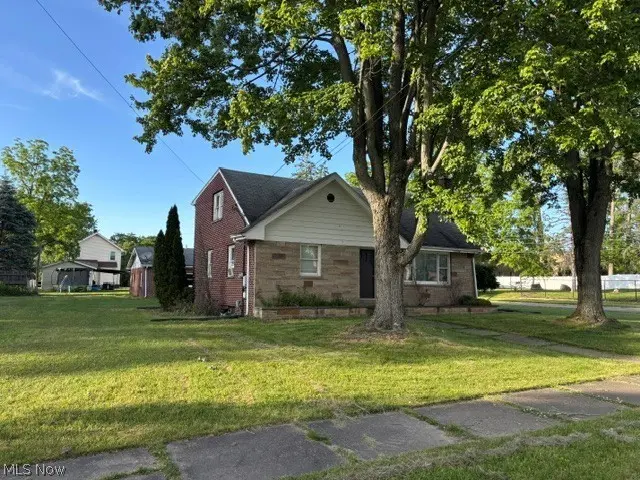
1006 Orlo
Warren, OH 44485
$159,900D
2 bd · 1.0 ba ·
1,590 sqft ·
Built 1963
· SingleFamily
· Active
· 16 DOM
Cashflow @ list (25.0% down · 7.5%)
Estimated rent
$1,213/mo
Mortgage (P&I)
−$839
Tax + insurance
−$169
HOA
−$0
Vac / Maint / Mgmt
−$255
Net cashflow
$-49/mo
Annual
$-590/yr
Cap rate
5.92%
Cash-on-cash
-1.32%
DSCR
0.94
1% rule
0.76%
Cash to close
$44,772
Investor read
- This is a 2-bed/1.0-bath single-family listed at $160k.
- At list price, monthly cash flow is $-49 ($-590/yr) — negative.
- To cash-flow at today's rent, offer at most $151k (5.4% below list).
- To meet the 1% rule (rent ≥ 1% of price), the offer needs to be $121k (24.1% below list).
- It's been on market 16 days — a 2% lower offer ($158k) is reasonable based on typical stale-listing flexibility.
- Recommended offer: $121k (24.1% below list) — sets the bar for 1% rule.
- Local home prices are declining (-1.1%/yr); year-one equity from $1k of loan paydown is wiped out by about $2k of value loss. Plan a longer hold.
- Location reads 73/100 on livability (#312 in OH) — a middle-class / working-renter tenant base. Strengths: cost of living A+, health & safety A+, housing A; Watch: crime D-, commute F, employment F.
- Warren City (urban): math 22% / reading 32% proficiency, ranked #599 of 656 in OH (top 91%) — low school quality limits family demand, transient renter base, plan for 1-2y turnover; 75% free/reduced lunch — lower-income household profile, screen leases tightly.
- Market conditions: 42 active listings in the ZIP; 2 comparable units currently listed for rent nearby; lower-income renter base — watch delinquency; 129 units permitted in Trumbull County in 2024 (0 in 5+ unit buildings).
- Trumbull County population projected at -22% by 2050 — secular population decline; favor cash flow + early exit over multi-decade hold.
- 2 sale attempts since 11y ago with the ask held roughly flat each time — persistent listings suggest the price (not the market) is what's stuck; bring a comps-based counter.
- Current owner paid $25k; list at $160k implies a 540% gain — meaningful room to come down on a strong offer.
- This rent runs 43% of the median local income ($34k/yr) — at the standard rent-burdened threshold; future hikes will face affordability resistance.
Questions for listing agent
- What do current leases actually rent for vs. the listed asking? Can we see a recent rent roll and the last 12 months of T-12 income?
- Built in 1963 — when were the roof, HVAC, electrical panel, plumbing, and water heater last replaced?
- Is there a deadline driving the sale (1031 exchange, divorce, estate, relocation)? That informs how much negotiation room exists.
- Crime grade is D in this area — have there been break-ins, vandalism, or insurance claims at this property in the last 3 years? What carrier currently insures it and at what premium?
- The area grade is low — what's the realistic commute time and amenity access for the typical tenant pool here? Any planned neighborhood developments (good or bad) we should know about?
- What's the average days-on-market for RENTAL listings here right now (not sales)? A rising rental-DOM trend means longer vacancies and softer asking-rent achievability than the comps imply.
- What's the recent tenant-quality profile in this submarket — average credit score on applications, eviction rate, late-payment / NSF rate, and stable-employment percentage? A property-management company in the area should have these aggregated.
- How much new for-sale + rental construction is in the pipeline within 1–3 miles? Heavy new supply typically softens prices + rents 12–24 months out; constrained supply supports both.
CashFlowRE · CFR-FYWAZSAF2E96R9
· Data 1 day ago
cashflowre.app · 2026-05-29