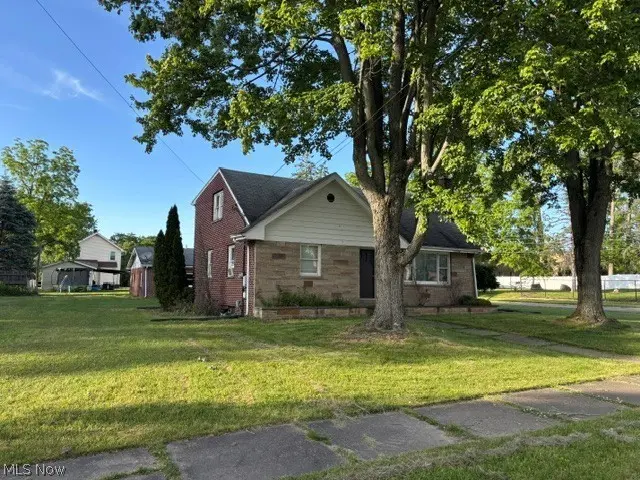
1006 Orlo · Warren, OH
Flood risk 1/10 · Minimal
- FEMA flood zone
- X (unshaded)
- Chance of flooding over 30 yrs
- 0.0%
- Est. flood insurance / yr
- $473 – $860
Fire risk 1/10 · Minimal
- Est. fire insurance / yr
- $713 – $1,323
Heat risk 3/10 · Minor
- Hot days now (above 97°F)
- 7 days/yr
- Hot days in 30 yrs
- 17 days/yr
Wind risk 1/10 · Minimal
- Chance of severe wind over 30 yrs
- —
Air-quality risk 3/10 · Minor
- Unhealthy air days now
- 1 days/yr
- Unhealthy air days in 30 yrs
- 4 days/yr
Risk factors via First Street. Map © Google.
Why this score? — see what drove the D grade
The composite is a weighted blend of 9 inputs, each scored 0–100. Each bar is that input's sub-score; the figure is the points it added to the 100-point composite (weight × sub-score).
- Cash flow +11.6/30.0
- ARV discount +7.7/15.0
- Appreciation +4.4/10.0
- Livability +3.7/5.0
- DSCR +3.4/10.0
- 1% rule +2.6/10.0
- Rent growth +2.5/5.0
- Condition / age +2.5/5.0
- Schools +2.2/10.0
$159,900
🖨 Deal sheet 📄 Offer letter ✓ Due diligence
Listing remarks
Charming all brick Cape Cod on a double lot features 4 bedrooms, 2 full baths, 2 fireplaces spacious eat-in kitchen & oversized all brick 2.5 garage. New boiler system in 2021. All appointments require 24 hr. notice.
Key facts
- 0.4 acre lot
- 2 garage spots
- Built 1963
Property features AI
Exterior
- Parking: Detached carport; Detached garage with 2-car capacity
- Utilities: Public water; Public sewer
- Home design: Brick and stone construction; Asphalt fiberglass roof
- Construction: Brick and stone exterior; Asphalt/Fiberglass roof
- Exterior features: 0.4-acre lot
Interior
- Kitchen: Eat-in kitchen
- Bedrooms: Two main-level bedrooms; Additional bedrooms on second floor
- Flooring: Carpet in some bedrooms and living room; Wood flooring on second-floor rooms; Linoleum in the eat-in kitchen
- Bathrooms: Two full bathrooms (one on the main level)
- Heating & cooling: Forced air heating; Gas heating; Fireplaces provide additional heat
- Interior features: Full basement; Two fireplaces (located in living room and basement)
Neighborhood map
What this means for you Summary
Snapshot
- This is a 2-bed/1.0-bath single-family listed at $160k.
Deal economics
- At list price, monthly cash flow is $-49 ($-590/yr) — negative.
- To cash-flow at today's rent, offer at most $151k (5.4% below list).
- To meet the 1% rule (rent ≥ 1% of price), the offer needs to be $121k (24.1% below list).
- Recommended offer: $121k (24.1% below list) — sets the bar for 1% rule.
Location & tenants
- Location reads 73/100 on livability (#312 in OH) — a middle-class / working-renter tenant base. Strengths: cost of living A+, health & safety A+, housing A; Watch: crime D-, commute F, employment F.
- Warren City (urban): math 22% / reading 32% proficiency, ranked #599 of 656 in OH (top 91%) — low school quality limits family demand, transient renter base, plan for 1-2y turnover; 75% free/reduced lunch — lower-income household profile, screen leases tightly.
- Market conditions: 42 active listings in the ZIP; 2 comparable units currently listed for rent nearby; lower-income renter base — watch delinquency; 129 units permitted in Trumbull County in 2024 (0 in 5+ unit buildings).
- This rent runs 43% of the median local income ($34k/yr) — at the standard rent-burdened threshold; future hikes will face affordability resistance.
Forward outlook
- Local home prices are declining (-1.1%/yr); year-one equity from $1k of loan paydown is wiped out by about $2k of value loss. Plan a longer hold.
- Trumbull County population projected at -22% by 2050 — secular population decline; favor cash flow + early exit over multi-decade hold.
Negotiation context
- It's been on market 16 days — a 2% lower offer ($158k) is reasonable based on typical stale-listing flexibility.
- 2 sale attempts since 11y ago with the ask held roughly flat each time — persistent listings suggest the price (not the market) is what's stuck; bring a comps-based counter.
- Current owner paid $25k; list at $160k implies a 540% gain — meaningful room to come down on a strong offer.
Questions for the listing agent
- What do current leases actually rent for vs. the listed asking? Can we see a recent rent roll and the last 12 months of T-12 income?
- Built in 1963 — when were the roof, HVAC, electrical panel, plumbing, and water heater last replaced?
- Is there a deadline driving the sale (1031 exchange, divorce, estate, relocation)? That informs how much negotiation room exists.
- Crime grade is D in this area — have there been break-ins, vandalism, or insurance claims at this property in the last 3 years? What carrier currently insures it and at what premium?
- The area grade is low — what's the realistic commute time and amenity access for the typical tenant pool here? Any planned neighborhood developments (good or bad) we should know about?
- What's the average days-on-market for RENTAL listings here right now (not sales)? A rising rental-DOM trend means longer vacancies and softer asking-rent achievability than the comps imply.
- What's the recent tenant-quality profile in this submarket — average credit score on applications, eviction rate, late-payment / NSF rate, and stable-employment percentage? A property-management company in the area should have these aggregated.
- How much new for-sale + rental construction is in the pipeline within 1–3 miles? Heavy new supply typically softens prices + rents 12–24 months out; constrained supply supports both.
Investment metrics
- 1% rule
- 0.76% ✗
- Cap rate
- 5.92%
- Cash-on-cash
- -1.32%
- DSCR
- 0.94
- GRM
- 11.0
CMA / ARV
- ARV (on-the-fly)
- $160,590
- Comps found
- 12
Show comp detail 12 sales within ~0.75 mi
| Address | Dist | Beds/Ba | Sqft | Sold | Price | $/sf | Match |
|---|---|---|---|---|---|---|---|
| 1325 Moncrest Dr NW | 0.30mi | 3/1.5 (+1) | 1,478 (-7%) | 6mo | $162,000 | $110 | 62 |
| 1905 Monticello Ave NW | 0.55mi | 3/2.0 (+1) | 1,560 (-2%) | 1mo | $157,000 | $101 | 61 |
| 1581 Drexel Ave NW | 0.46mi | 3/2.5 (+1) | 1,506 (-5%) | 0mo | $180,000 | $120 | 58 |
| 1587 Drexel Ave NW | 0.46mi | 3/2.5 (+1) | 1,508 (-5%) | 1mo | $170,000 | $113 | 58 |
| 1595 Drexel Ave NW | 0.44mi | 3/2.5 (+1) | 1,506 (-5%) | 2mo | $180,000 | $120 | 58 |
| 1575 Drexel Ave NW | 0.46mi | 3/2.5 (+1) | 1,506 (-5%) | 3mo | $170,000 | $113 | 57 |
| 442 Belmont Ave | 0.54mi | 3/1.0 (+1) | 1,462 (-8%) | 2mo | $55,000 | $38 | 54 |
| 439 School St NW | 0.65mi | 3/1.0 (+1) | 1,504 (-5%) | 15mo | $93,000 | $62 | 43 |
| 783 Packard St NW | 0.64mi | 3/1.5 (+1) | 1,356 (-15%) | 6mo | $115,000 | $85 | 34 |
| 929 Comstock St NW | 0.65mi | 3/2.0 (+1) | 1,400 (-12%) | 12mo | $121,800 | $87 | 30 |
| 724 Packard St NW | 0.69mi | 3/1.5 (+1) | 1,359 (-14%) | 13mo | $82,000 | $60 | 26 |
| 2212 Mahoning Ave NW | 0.72mi | 3/2.0 (+1) | 1,353 (-15%) | 15mo | $44,000 | $33 | 20 |
Match score weights: distance 35% · size 25% · config 20% · recency 20%. Top-matched comps best support the ARV.
Projected returns pro-forma
-1.14% appreciation · 3.0% rent growth · sell at horizon
- IRR
- -8.5%
- Equity multiple
- 0.64×
- Total profit
- $-16,217
- Equity at exit
- $37,532
- IRR
- -1.6%
- Equity multiple
- 0.86×
- Total profit
- $-6,328
- Equity at exit
- $38,510
Cash invested: $44,772 (down + closing). Projections, not guarantees.
Landlord ↔ Tenant lean methodology
- Overall (STATE)
- 73 Landlord-Friendly
- State Ohio
- 73 Landlord-Friendly · R+6
- County
- — inherits STATE
- City
- — inherits STATE
ZIP-level market 44485
- Home prices YoY
- -0.5%
- Active inventory
- 42
- Price-to-rent
- 11.0×
Monthly cashflow live
- Estimated rent
- $1,213 medium interval (Pro) →
- Mortgage (P&I)
- −$839
- Tax from tax record
- −$102 /mo · $1,228/yr
- Insurance
- −$67
- HOA
- −$0
- Vacancy / Maint / Mgmt
- −$255
- Net cashflow
- $-49
Break-even live
UW: 25.0% down · 7.5% · 30yr · 1.5% tax · 5.0% vac · 8.0% maint · 8.0% mgmt
Financing live
Cash to close
- Down payment
- $39,975
- Closing costs
- $4,797
- Reserves months
- —
- Total cash needed
- —
Loan-product check · same deal, 3 products live
Conventional
25% down · 7.5% · 30yr
- Down + closing
- —
- Monthly P&I
- —
- Monthly cashflow
- —
- DSCR
- —
- Eligible?
- —
Personal DTI + credit; lowest rate.
DSCR
20% down · 8.5% · 30yr
- Down + closing
- —
- Monthly P&I
- —
- Monthly cashflow
- —
- DSCR
- —
- Eligible?
- —
No personal income docs; deal must DSCR.
Hard money
10% down · 12.0% · 12mo
- Down + closing
- —
- Monthly P&I
- —
- Monthly cashflow
- —
- DSCR
- —
- Eligible?
- —
Short-term bridge; refi at stabilization.
Rent comps 2 comps
| Address | Beds | Baths | Sqft | Rent | $/sqft | DOM | Units | Dist |
|---|---|---|---|---|---|---|---|---|
| 1388 Beechcrest St NW Warren, OH | 3.0 | 2.0 | 1297 | $1,195 | $0.92 | 13d | 1 | 0.52mi |
| 407 Washington St NE Niles, OH | 3.0 | 1.5 | 1388 | $1,250 | $0.90 | 13d | 1 | 1.13mi |
Listing history 13 events
-
2026-06-19days on market $159,900 Active 16 DOM
-
2026-06-18days on market $159,900 Active 15 DOM
-
2026-06-17days on market $159,900 Active 14 DOM
-
2026-06-16days on market $159,900 Active 13 DOM
-
2026-06-15days on market $159,900 Active 12 DOM
-
2026-06-14days on market $159,900 Active 10 DOM
-
2026-06-13days on market $159,900 Active 9 DOM
-
2026-06-10days on market $159,900 Active 7 DOM
-
2026-06-09days on market $159,900 Active 6 DOM
-
2026-06-08days on market $159,900 Active 5 DOM
-
2026-06-07days on market $159,900 Active 4 DOM
-
2026-06-05remarks 218-char remark
-
2026-06-05$159,900 Active 1 DOM
ⓘ Source: listings_history table (triggers on properties + properties_extension) + one-shot
backfill from property_details.listing_events for pre-trigger history.
Tax reassessment forecast OH · Partial reset (capped growth)
- Current annual tax
- $1,228 · $102/mo
- Projected year-2 tax
- $1,861 · $155/mo
- Expected delta
- +$633/yr (+$53/mo · 51.5%)
ⓘ Screening estimate from a state-policy table — verify with the county assessor before closing.
Climate risk First Street
- Flood 1/10 Low FEMA zone X (unshaded) · 0% chance over 30 yrs
- Wildfire 1/10 Low
- Heat 3/10 Moderate 7 d/yr ≥97°F today · 17 d/yr by 30 yrs out
- Wind 1/10 Low
- Air quality 3/10 Moderate 1 unhealthy d/yr today · 4 by 30 yrs out
Nearby sold comps map
Loading sold comps map…
Walkable amenities ~0.75 mi
Loading nearby amenities…
Taxation est. · year 1
- Rental income
- $14,557
- − Mortgage interest
- −$8,957
- − Property taxes
- −$1,228
- − Insurance
- −$800
- − Repairs & maintenance
- −$1,165
- − Management
- −$1,165
- − Depreciation
- −$4,652
- Taxable loss
- −$3,409
- Est. tax savings @ 24.0%
- +$818
- After-tax cash flow
- $228/yr
For passive investors: Depreciation is non-cash, so a rental often shows a tax loss while cash-flowing — sheltering income. Rental losses are passive: they offset passive income freely, and up to $25,000/yr can offset ordinary (W-2) income if you actively participate and your MAGI is under $100k (phasing out to $0 by $150k); unused losses carry forward. On sale, claimed depreciation is recaptured at up to 25%, and gains may owe capital-gains tax (a 1031 exchange can defer both). Figures are a year-1 estimate at your 24.0% rate — not tax advice; consult a CPA.
Schools (NCES district)
- District
- Warren City
- NCES district ID
- 3904499
- Math proficiency
- 22% ▼ -16.00%
- Reading proficiency
- 32% ▼ -9.00%
- Median HH income
- $28,222
- Composite
- 21.6/100
- National rank
- #8299
- State rank
- #599 of 656 in OH
Livability — Warren
- Score
- 73/100
- State rank
- #312
- US rank
- #5068
Category grades
Schools grade is shown separately in the Schools card above.
Census & demographics
- Census place
- Warren, OH
- County
- Trumbull · 193,293 people
- City population
- 25,805
- Metro
- Youngstown-Warren, OH
- Population (ZIP)
- 15,194
- Household income
- $33,720
- Rent vs Own
- Severe rent burden
- 14.2
Population outlook (Trumbull County) Hauer SSP2
- Today (2025)
- 191,696 people
- By 2030
- 184,015 · -4.0%
- By 2040
- 166,810 · -13.0%
- By 2050
- 149,857 · -21.8%
- By 2075
- 115,769 · -39.6%
- By 2100
- 83,617 · -56.4%
Race, ethnicity, and origin ACS 2023
- Neighborhood character
- Diverse neighborhood (Simpson 0.57)
- Race & ethnicity
- White 54% Black 38% Two or more races 5% Hispanic / Latino 3%
- Common ancestry
- Lithuanian 1% Slovak 1% Iranian 1%
- Foreign-born
- 1%
- Languages at home
- 99% English-only · Other Indo-European 1%
Political lean MEDSL · Trumbull
- 2024 margin
- R (+16.8) · D 41.2% · R 58.0%
- 2008→2024 swing
- -39.2pp toward R · 2008: 22.4pp · 2024: -16.8pp
- All cycles
- 2024: R+16.8 2020: R+10.6 2016: R+6.4 2012: D+22.2 2008: D+22.4
Not yet ingested
- Civics
- —
Market trends
- HPI YoY
- ▼ -1.14%
- Current HPI
- 212.5324
- Rent YoY
- —
- Metro
- —
- State GDP YoY
- ▲ 1.98%
- F500 in state
- 48
Industry mix (Fortune 500 HQ in OH)
| Industry | F500 HQs | Revenue |
|---|---|---|
| Insurance | 3 | $145B |
|
||
| Industrial Machinery | 3 | $49B |
|
||
| Financial Services | 3 | $24B |
|
||
| Consumer Goods | 2 | $93B |
|
||
| Aerospace / Defense | 2 | $47B |
|
||
| Utilities | 2 | $33B |
|
||
Price history
+539.6% since first listed4 events — show timeline
- 2026-06-02 Listed $159,900 MLSNOW
- 2015-05-15 Listing Removed — MLSNOW
- 2015-03-04 Listed $49,900 MLSNOW
- 2013-11-20 Sold (Public Records) $25,000 Public Records
Property tax history
+7.0%/yrLatest (2025): $1,228 · +1.9% YoY. Source: county tax records.
Cash-flow waterfall
monthlySold comps — $/sqft
last 12 mo · ≤1 miLoading sold comps…