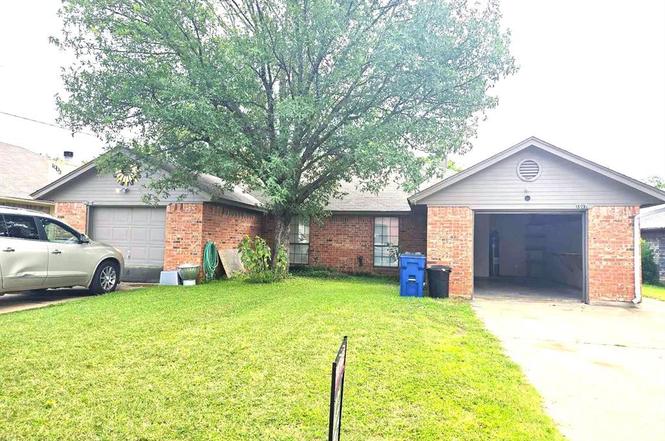
1007 Mitchell Ln
Burleson, TX 76028
$204,500D-
3 bd · 2.0 ba ·
1,261 sqft ·
Built 1986
· MultiFamily
· Active
· 3 DOM
Cashflow @ list (25.0% down · 7.5%)
Estimated rent
$1,884/mo
Mortgage (P&I)
−$1,072
Tax + insurance
−$492
HOA
−$0
Vac / Maint / Mgmt
−$396
Net cashflow
$-77/mo
Annual
$-920/yr
Cap rate
5.84%
Cash-on-cash
-1.61%
DSCR
0.93
1% rule
0.92%
Cash to close
$57,260
Investor read
- This is a 3-bed/2.0-bath multifamily listed at $204k.
- At list price, monthly cash flow is $-77 ($-920/yr) — negative.
- To cash-flow at today's rent, offer at most $191k (6.6% below list).
- To meet the 1% rule (rent ≥ 1% of price), the offer needs to be $188k (7.9% below list).
- Only 3 days on market — expect competitive offers; lowballing is unlikely to land.
- Recommended offer: $188k (7.9% below list) — sets the bar for 1% rule.
- Local home prices are declining (-3.0%/yr); year-one equity from $1k of loan paydown is wiped out by about $6k of value loss. Plan a longer hold.
- Location reads 79/100 on livability (#53 in TX, #2,133 nationally) — a middle-class / working-renter tenant base. Strengths: employment A+, cost of living A+, housing A+; Watch: amenities F, commute F.
- Burleson ISD (suburban): math 41% / reading 48% proficiency, ranked #236 of 826 in TX (top 29%) — families likely to look elsewhere, expect single-tenant / working-renter base with shorter leases.
- Zoned schools: Norwood El (math 32% / reading 37%, grade F, #1,995 of 4,322 statewide, top 50%, 474 students, 63% FRL) — zoned schools average 63% FRL vs 32% district-wide (30 pts higher); higher-poverty schools than district average — tighter screening recommended.
- Market conditions: Rents rising (+1.8%/yr); 679 active listings in the ZIP; 30 comparable units currently listed for rent nearby; rentals at typical pace (median 18d on market — plan ~3-4 weeks tenant-placement turnaround); solid renter incomes; 2,152 units permitted in Johnson County in 2024 (76 in 5+ unit buildings).
- Johnson County population projected at +24% by 2050 — long-run rental-demand tailwind backs the buy-and-hold thesis.
- Climate carrying-cost: major wind risk, 27% chance of damaging wind over 30y; extreme-heat days projected 7→25/yr by 2055 (HVAC capex compounding) — expect insurance premiums to compound above CPI over the hold.
- Cap rate 5.8% vs local median 3.5% in Burleson — top-decile yield for the area; either an underpriced asset or a hidden risk that comps aren't pricing in. Stress-test before assuming the spread holds.
Questions for listing agent
- What do current leases actually rent for vs. the listed asking? Can we see a recent rent roll and the last 12 months of T-12 income?
- Is there a deadline driving the sale (1031 exchange, divorce, estate, relocation)? That informs how much negotiation room exists.
- The area grade is low — what's the realistic commute time and amenity access for the typical tenant pool here? Any planned neighborhood developments (good or bad) we should know about?
- What's the average days-on-market for RENTAL listings here right now (not sales)? A rising rental-DOM trend means longer vacancies and softer asking-rent achievability than the comps imply.
- What's the recent tenant-quality profile in this submarket — average credit score on applications, eviction rate, late-payment / NSF rate, and stable-employment percentage? A property-management company in the area should have these aggregated.
- How much new apartment / multifamily construction is in the pipeline within 1–3 miles? Heavy new supply (>2% of stock underway) typically softens rents 12–24 months out; light construction supports rent growth.
CashFlowRE · CFR-FZF6C51W268MBX
· Data 2 days ago
cashflowre.app · 2026-05-29