 Multi-family
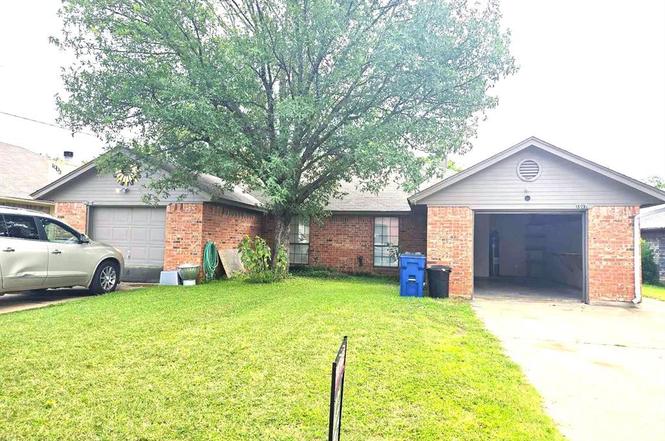
1007 Mitchell Ln · Burleson, TX
Flood risk 1/10 · Minimal
- FEMA flood zone
- X (unshaded)
- Chance of flooding over 30 yrs
- 0.0%
- Est. flood insurance / yr
- $507 – $1,088
Fire risk 4/10 · Minor
- Est. fire insurance / yr
- $1,222 – $2,270
Heat risk 7/10 · Major
- Hot days now (above 109°F)
- 7 days/yr
- Hot days in 30 yrs
- 25 days/yr
Wind risk 6/10 · Moderate
- Chance of severe wind over 30 yrs
- 27.0%
Air-quality risk 2/10 · Minimal
- Unhealthy air days now
- 2 days/yr
- Unhealthy air days in 30 yrs
- 2 days/yr
Risk factors via First Street. Map © Google.
Why this score? — see what drove the D- grade
The composite is a weighted blend of 9 inputs, each scored 0–100. Each bar is that input's sub-score; the figure is the points it added to the 100-point composite (weight × sub-score).
- Cash flow +11.3/30.0
- ARV discount +7.5/15.0
- 1% rule +4.2/10.0
- Schools +4.0/10.0
- Livability +4.0/5.0
- DSCR +3.3/10.0
- Rent growth +2.9/5.0
- Condition / age +2.5/5.0
- Appreciation +0.0/10.0
$204,500
🖨 Deal sheet 📄 Offer letter ✓ Due diligence
Multi-family units
County records classify this as Multi-Family (2-4 Unit). Listing-text estimate: 1 unit. estimate disagrees with records
Listing remarks
Great opportunity for investors! Move-in ready and beautifully updated, this charming half of duplex offers 3-bedroom, 2-bath home with approximately 1,261 square feet of comfortable living space in the heart of Burleson. Recent improvements include new flooring 2026, remodeled both bathrooms, fresh paint throughout. Close to walking trails, ball park, schools and Bailey Lake. Walmart and restaurants just minutes away. Both sides of the duplex will be sold together! Pictures for 1005 Mitchell Ln could be found through MLS # 21301750
Key facts
- Fresh paint
- New flooring
- Bailey lake
Tags
Property features AI
Finance
- Other: Smart home features present (HVAC-related energy efficiency); Possession negotiable or after lease outstanding; Subdivision: Gardens; County: Johnson
- Financial info: Listing terms: Cash or Conventional; No second mortgage indicated
- HOA & community: No association
Exterior
- Parking: Driveway; On-street parking; Attached garage (1-car; approx. 10' x 11'); No carport
- Security: Smoke detector(s)
- Utilities: City water; City sewer; Electricity available; Cable available; Sewer available
- Home design: Single-family residence; Attached property; Built in 1986; One story; Composition roof
- Construction: Brick construction; Slab foundation
- Exterior features: Fenced yard (wood); Interior lot; Sidewalk; Community mailbox
Interior
- Kitchen: Dishwasher; Disposal; Electric cooktop
- Bedrooms: Primary bedroom (1st floor), approximately 16 x 12; Total of 3 bedrooms
- Flooring: Luxury vinyl plank; Tile
- Bathrooms: 2 full bathrooms
- Heating & cooling: Central heating (electric); Central air conditioning (electric); Ceiling fan(s)
- Interior features: Cable TV available; Flat screen wiring; High-speed internet available; Walk-in closet(s); One living area; One dining area; Room count: 4; Levels: One
- Laundry & utility: Washer hookup; Electric dryer hookup; Utility room
Neighborhood map
What this means for you Summary
Snapshot
- This is a 3-bed/2.0-bath multifamily listed at $204k.
Deal economics
- At list price, monthly cash flow is $-77 ($-920/yr) — negative.
- To cash-flow at today's rent, offer at most $191k (6.6% below list).
- To meet the 1% rule (rent ≥ 1% of price), the offer needs to be $188k (7.9% below list).
- Recommended offer: $188k (7.9% below list) — sets the bar for 1% rule.
- Cap rate 5.8% vs local median 3.5% in Burleson — top-decile yield for the area; either an underpriced asset or a hidden risk that comps aren't pricing in. Stress-test before assuming the spread holds.
Location & tenants
- Location reads 79/100 on livability (#53 in TX, #2,133 nationally) — a middle-class / working-renter tenant base. Strengths: employment A+, cost of living A+, housing A+; Watch: amenities F, commute F.
- Burleson ISD (suburban): math 41% / reading 48% proficiency, ranked #236 of 826 in TX (top 29%) — families likely to look elsewhere, expect single-tenant / working-renter base with shorter leases.
- Zoned schools: Norwood El (math 32% / reading 37%, grade F, #1,995 of 4,322 statewide, top 50%, 474 students, 63% FRL) — zoned schools average 63% FRL vs 32% district-wide (30 pts higher); higher-poverty schools than district average — tighter screening recommended.
- Market conditions: Rents rising (+1.8%/yr); 679 active listings in the ZIP; 30 comparable units currently listed for rent nearby; rentals at typical pace (median 18d on market — plan ~3-4 weeks tenant-placement turnaround); solid renter incomes; 2,152 units permitted in Johnson County in 2024 (76 in 5+ unit buildings).
Forward outlook
- Local home prices are declining (-3.0%/yr); year-one equity from $1k of loan paydown is wiped out by about $6k of value loss. Plan a longer hold.
- Johnson County population projected at +24% by 2050 — long-run rental-demand tailwind backs the buy-and-hold thesis.
Negotiation context
- Only 3 days on market — expect competitive offers; lowballing is unlikely to land.
Risks & watch-outs
- Climate carrying-cost: major wind risk, 27% chance of damaging wind over 30y; extreme-heat days projected 7→25/yr by 2055 (HVAC capex compounding) — expect insurance premiums to compound above CPI over the hold.
Questions for the listing agent
- What do current leases actually rent for vs. the listed asking? Can we see a recent rent roll and the last 12 months of T-12 income?
- Is there a deadline driving the sale (1031 exchange, divorce, estate, relocation)? That informs how much negotiation room exists.
- The area grade is low — what's the realistic commute time and amenity access for the typical tenant pool here? Any planned neighborhood developments (good or bad) we should know about?
- What's the average days-on-market for RENTAL listings here right now (not sales)? A rising rental-DOM trend means longer vacancies and softer asking-rent achievability than the comps imply.
- What's the recent tenant-quality profile in this submarket — average credit score on applications, eviction rate, late-payment / NSF rate, and stable-employment percentage? A property-management company in the area should have these aggregated.
- How much new apartment / multifamily construction is in the pipeline within 1–3 miles? Heavy new supply (>2% of stock underway) typically softens rents 12–24 months out; light construction supports rent growth.
Investment metrics
- 1% rule
- 0.92% ✗
- Cap rate
- 5.84%
- Cash-on-cash
- -1.61%
- DSCR
- 0.93
- GRM
- 9.0
CMA / ARV
No comps found within radius.
Projected returns pro-forma
-3.0% appreciation · 1.78% rent growth · sell at horizon
- IRR
- -20.4%
- Equity multiple
- 0.30×
- Total profit
- $-40,185
- Equity at exit
- $30,492
- IRR
- -16.7%
- Equity multiple
- 0.13×
- Total profit
- $-49,935
- Equity at exit
- $17,681
Cash invested: $57,260 (down + closing). Projections, not guarantees.
Landlord ↔ Tenant lean methodology
- Overall (STATE)
- 87 Strongly Landlord-Friendly
- State Texas
- 87 Strongly Landlord-Friendly · R+5
- County
- — inherits STATE
- City
- — inherits STATE
ZIP-level market 76028
- Home prices YoY
- -33.4%
- Rents YoY
- 1.8%
- Active inventory
- 679
- Price-to-rent
- 9.0×
Monthly cashflow live
- Estimated rent
- $1,884 high interval (Pro) →
- Mortgage (P&I)
- −$1,072
- Tax from tax record
- −$407 /mo · $4,885/yr
- Insurance
- −$85
- HOA
- −$0
- Vacancy / Maint / Mgmt
- −$396
- Net cashflow
- $-77
Break-even live
UW: 25.0% down · 7.5% · 30yr · 1.5% tax · 5.0% vac · 8.0% maint · 8.0% mgmt
Financing live
Cash to close
- Down payment
- $51,125
- Closing costs
- $6,135
- Reserves months
- —
- Total cash needed
- —
Loan-product check · same deal, 3 products live
Conventional
25% down · 7.5% · 30yr
- Down + closing
- —
- Monthly P&I
- —
- Monthly cashflow
- —
- DSCR
- —
- Eligible?
- —
Personal DTI + credit; lowest rate.
DSCR
20% down · 8.5% · 30yr
- Down + closing
- —
- Monthly P&I
- —
- Monthly cashflow
- —
- DSCR
- —
- Eligible?
- —
No personal income docs; deal must DSCR.
Hard money
10% down · 12.0% · 12mo
- Down + closing
- —
- Monthly P&I
- —
- Monthly cashflow
- —
- DSCR
- —
- Eligible?
- —
Short-term bridge; refi at stabilization.
Rent comps 30 comps
| Address | Beds | Baths | Sqft | Rent | $/sqft | DOM | Units | Dist |
|---|---|---|---|---|---|---|---|---|
| 1045 Mitchell Ln Unit 1045 Burleson, TX | 2.0 | 2.0 | 1100 | $1,600 | $1.45 | 19d | 1 | 0.12mi |
| 926 Irene St Burleson, TX | 3.0 | 2.0 | 1500 | $1,675 | $1.12 | 24d | 1 | 0.18mi |
| 724 Sue Ann Ln Burleson, TX | 3.0 | 2.0 | 1124 | $1,795 | $1.60 | 44d | 1 | 0.24mi |
| 745 W Hidden Creek Pkwy Burleson, TX | 2.0–3.0 | 2.0 | 1059 | $1,679 | $1.58 | 1d | 6 | 0.25mi |
| 634 Lisa St Burleson, TX | 3.0 | 2.0 | 1239 | $1,845 | $1.49 | 24d | 1 | 0.45mi |
| 712 Pecan St Burleson, TX | 3.0 | 2.0 | 1578 | $1,895 | $1.20 | 24d | 1 | 0.50mi |
| 128 Meador Ln Burleson, TX | 2.0 | 2.0 | 947 | $1,500 | $1.58 | 44d | 1 | 0.53mi |
| 100 Arnold Ave Burleson, TX | 3.0 | 2.0 | 1432 | $2,095 | $1.46 | 22d | 1 | 0.55mi |
| 720 Ash St Burleson, TX | 3.0 | 2.0 | 1565 | $1,925 | $1.23 | 44d | 1 | 0.55mi |
| 285 SE John Jones Dr Burleson, TX | 1.0–3.0 | 1.0–2.0 | 1094 | $2,154 | $1.97 | 1d | 16 | 0.65mi |
| 207 Stefanie St Burleson, TX | 3.0 | 2.0 | 1145 | $1,695 | $1.48 | 24d | 1 | 0.73mi |
| 428 Tinker Trl Burleson, TX | 2.0 | 2.0 | 1329 | $1,735 | $1.31 | 17d | 1 | 0.74mi |
| 105 SE Gardens Blvd Apt 108 Burleson, TX | 2.0 | 1.5 | 1019 | $1,425 | $1.40 | 24d | 1 | 0.75mi |
| 105 SE Gardens Blvd Apt 112 Burleson, TX | 2.0 | 1.5 | 1019 | $1,425 | $1.40 | 7d | 1 | 0.75mi |
| 155 Elk Dr Burleson, TX | 2.0 | 2.0 | 1150 | $1,797 | $1.56 | 1d | 6 | 0.83mi |
| 716 SW Sunset Ln Burleson, TX | 3.0 | 1.0 | 1018 | $1,725 | $1.69 | 44d | 1 | 0.84mi |
| 213 NW Jayellen Ave Burleson, TX | 4.0 | 2.0 | 1412 | $2,000 | $1.42 | 5d | 1 | 0.84mi |
| 232 Linda Dr Burleson, TX | 3.0 | 2.0 | 1554 | $1,875 | $1.21 | 4d | 1 | 0.91mi |
| 329 SE Robert St Burleson, TX | 3.0 | 1.5 | 1644 | $2,100 | $1.28 | 44d | 1 | 1.09mi |
| 621 Barkridge Trl Burleson, TX | 3.0 | 2.0 | 1444 | $2,000 | $1.39 | 13d | 1 | 1.20mi |
| 1633 Greenridge Dr Burleson, TX | 1.0–2.0 | 1.0–2.0 | 945 | $1,740 | $1.84 | 2d | 27 | 1.21mi |
| 501 Marybeth Dr Burleson, TX | 4.0 | 2.0 | 1813 | $2,270 | $1.25 | 44d | 1 | 1.21mi |
| 912 Vaughn Dr Burleson, TX | 3.0 | 2.0 | 1144 | $1,700 | $1.49 | 17d | 1 | 1.25mi |
| 900 Vaughn Dr Burleson, TX | 3.0 | 2.0 | 1408 | $2,200 | $1.56 | 44d | 1 | 1.25mi |
| 1700 Fairfield Pkwy Unit 1733 Burleson, TX | 3.0 | 2.0 | 1398 | $2,050 | $1.47 | 1d | 1 | 1.27mi |
| 1700 Fairfield Pkwy Unit 1757 Burleson, TX | 2.0 | 2.0 | 1127 | $1,474 | $1.31 | 3d | 1 | 1.27mi |
| 1700 Fairfield Pkwy Unit 1737 Burleson, TX | 2.0 | 2.0 | 1127 | $1,658 | $1.47 | 15d | 1 | 1.27mi |
| 1700 Fairfield Pkwy Unit 1723 Burleson, TX | 2.0 | 2.0 | 1127 | $1,683 | $1.49 | 13d | 1 | 1.27mi |
| 1626 SW Wilshire Blvd Burleson, TX | 3.0 | 2.0 | 1380 | $1,925 | $1.39 | 7d | 1 | 1.36mi |
| 4505 Cross Timber Rd Burleson, TX | 2.0 | 1.0 | 1809 | $2,500 | $1.38 | 1d | 1 | 1.41mi |
Listing history 4 events
-
2026-06-18days on market $204,500 Active 3 DOM
-
2026-06-17days on market $204,500 Active 2 DOM
-
2026-06-15remarks 538-char remark
-
2026-06-15$204,500 Active 1 DOM
ⓘ Source: listings_history table (triggers on properties + properties_extension) + one-shot
backfill from property_details.listing_events for pre-trigger history.
Tax reassessment forecast TX · Resets to sale price
- Current annual tax
- $4,885 · $407/mo
- Projected year-2 tax
- $4,885 · $407/mo
- Expected delta
- $0/yr ($0/mo · 0.0%)
ⓘ Screening estimate from a state-policy table — verify with the county assessor before closing.
Climate risk First Street
- Flood 1/10 Low FEMA zone X (unshaded) · 0% chance over 30 yrs
- Wildfire 4/10 Moderate
- Heat 7/10 Severe 7 d/yr ≥109°F today · 25 d/yr by 30 yrs out
- Wind 6/10 Major 27% chance of damaging wind over 30 yrs
- Air quality 2/10 Low 2 unhealthy d/yr today · 2 by 30 yrs out
Nearby sold comps map
Loading sold comps map…
Walkable amenities ~0.75 mi
Loading nearby amenities…
Taxation est. · year 1
- Rental income
- $22,603
- − Mortgage interest
- −$11,455
- − Property taxes
- −$4,885
- − Insurance
- −$1,022
- − Repairs & maintenance
- −$1,808
- − Management
- −$1,808
- − Depreciation
- −$5,949
- Taxable loss
- −$4,325
- Est. tax savings @ 24.0%
- +$1,038
- After-tax cash flow
- $118/yr
For passive investors: Depreciation is non-cash, so a rental often shows a tax loss while cash-flowing — sheltering income. Rental losses are passive: they offset passive income freely, and up to $25,000/yr can offset ordinary (W-2) income if you actively participate and your MAGI is under $100k (phasing out to $0 by $150k); unused losses carry forward. On sale, claimed depreciation is recaptured at up to 25%, and gains may owe capital-gains tax (a 1031 exchange can defer both). Figures are a year-1 estimate at your 24.0% rate — not tax advice; consult a CPA.
Schools (NCES district)
- District
- Burleson ISD
- NCES district ID
- 4812180
- Math proficiency
- 41% ▼ -8.00%
- Reading proficiency
- 48% ▼ -3.00%
- Median HH income
- $69,349
- Composite
- 40.05/100
- National rank
- #3818
- State rank
- #236 of 826 in TX
Livability — Burleson
- Score
- 79/100
- State rank
- #53
- US rank
- #2133
Category grades
Schools grade is shown separately in the Schools card above.
Census & demographics
- Census place
- Burleson, TX
- County
- Johnson County · 147,987 people
- City population
- 81,549
- Metro
- Dallas-Fort Worth-Arlington, TX
- Population (ZIP)
- 81,549
- Household income
- $101,138
- Rent vs Own
- Severe rent burden
- 1117.0
Population outlook (Johnson County) Hauer SSP2
- Today (2025)
- 179,678 people
- By 2030
- 189,208 · +5.3%
- By 2040
- 207,261 · +15.4%
- By 2050
- 223,064 · +24.1%
- By 2075
- 259,979 · +44.7%
- By 2100
- 275,395 · +53.3%
Race, ethnicity, and origin ACS 2023
- Neighborhood character
- Predominantly White (69%)
- Race & ethnicity
- White 69% Hispanic / Latino 19% Two or more races 11% Black 6% Asian 1%
- Hispanic origin (detail)
- Mexican 17%
- Common ancestry
- Lithuanian 2% Italian 2% Slovak 2%
- Foreign-born
- 5% · Canada
- Languages at home
- 88% English-only · Spanish 10% Other Indo-European 1%
Political lean MEDSL · Johnson
- 2024 margin
- Solid R (+51.4) · D 23.9% · R 75.3%
- 2008→2024 swing
- -3.9pp toward R · 2008: -47.5pp · 2024: -51.4pp
- All cycles
- 2024: R+51.4 2020: R+53.0 2016: R+58.3 2012: R+55.6 2008: R+47.5
Not yet ingested
- Civics
- —
Market trends
- HPI YoY
- ▼ -141.44%
- Current HPI
- 282.466
- Rent YoY
- ▲ 1.78%
- Metro
- Dallas-Fort Worth-Arlington, TX
- State GDP YoY
- ▲ 3.95%
- F500 in state
- 110
Industry mix (Fortune 500 HQ in TX)
| Industry | F500 HQs | Revenue |
|---|---|---|
| Energy | 16 | $1,198B |
|
||
| Technology | 5 | $198B |
|
||
| Engineering / Construction | 4 | $72B |
|
||
| Energy Services | 3 | $60B |
|
||
| Utilities | 3 | $41B |
|
||
| Healthcare | 2 | $330B |
|
||
Price history
2 events — show timeline
- 2026-06-15 Listed $204,500 NTREIS
- 2000-06-14 Sold (Public Records) — Public Records
Property tax history
+7.1%/yrLatest (2025): $4,885 · +3.0% YoY. Source: county tax records.
Cash-flow waterfall
monthlySold comps — $/sqft
last 12 mo · ≤1 miLoading sold comps…