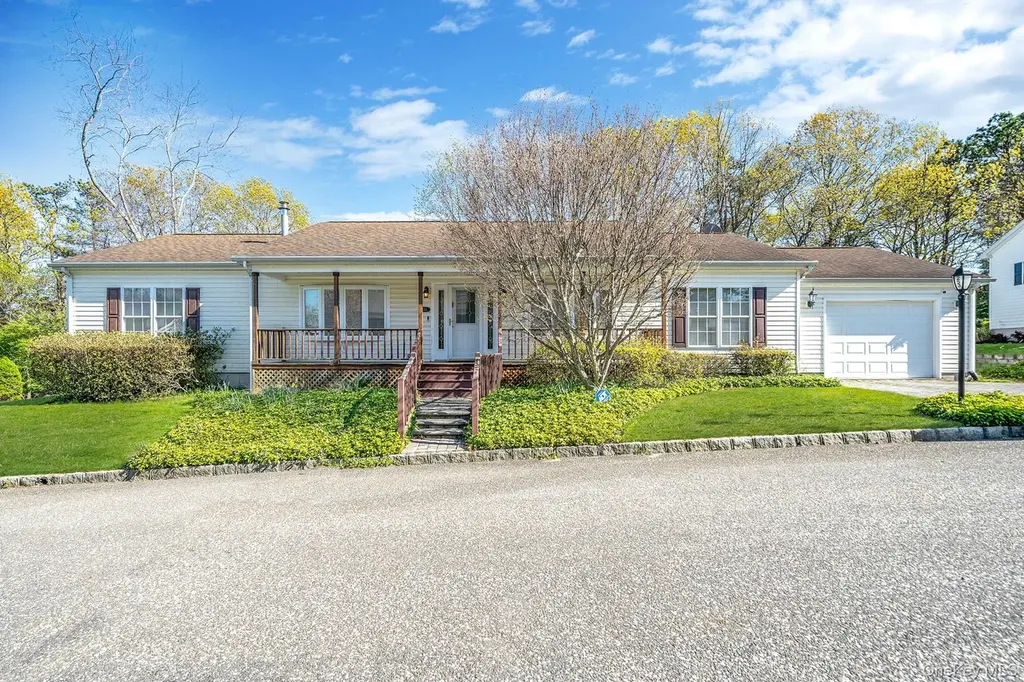
1407 Middle Rd #253
Calverton, NY 11933
$449,000B-
3 bd · 2.0 ba ·
1,753 sqft ·
Built 2005
· Manufactured
· Active
· 30 DOM
Cashflow @ list (25.0% down · 7.5%)
Estimated rent
$8,014/mo
Mortgage (P&I)
−$2,355
Tax + insurance
−$703
HOA
−$839
Vac / Maint / Mgmt
−$1,683
Net cashflow
$2,435/mo
Annual
$29,217/yr
Cap rate
12.80%
Cash-on-cash
23.24%
DSCR
2.03
1% rule
1.78%
Cash to close
$125,720
Investor read
- This is a 3-bed/2.0-bath manufactured listed at $449k.
- At list price, monthly cash flow is $2k ($29k/yr) — positive.
- The deal already cash-flows at list — no discount required.
- Meets the 1% rule at list price ($8k rent vs $449k).
- It's been on market 30 days — a 2% lower offer ($442k) is reasonable based on typical stale-listing flexibility.
- Recommended offer: $442k (1.5% below list) — sets the bar for market timing.
- In year one you build about $18k of equity ($3k loan paydown + $15k appreciation (3.3% local appreciation)).
- Location reads 58/100 on livability (#1,053 in NY) — a working-class tenant base; expect higher turnover. Watch: crime C-, schools D, employment D.
- Riverhead Central School District (suburban): math 34% / reading 48% proficiency, ranked #489 of 590 in NY (top 83%) — families likely to look elsewhere, expect single-tenant / working-renter base with shorter leases.
- Market conditions: 84 active listings in the ZIP; 2 comparable units currently listed for rent nearby; 1,366 units permitted in Suffolk County in 2024 (216 in 5+ unit buildings).
- Suffolk County population projected to shrink 5% by 2050 — rents likely to lag national; underwrite the cash flow, not the appreciation.
- 2 sale attempts since 3y ago with the ask held roughly flat each time — persistent listings suggest the price (not the market) is what's stuck; bring a comps-based counter.
- At projected returns (3.3% appreciation + 3.0% rent growth), your $126k cash investment doubles in ~3 years — after that, you're playing with house money.
- By year 3, paydown + projected appreciation supports a ~$44k cash-out refi (75% LTV) — recoverable capital for the next deal without selling this one.
- Climate carrying-cost: severe wind risk, 80% chance of damaging wind over 30y — expect insurance premiums to compound above CPI over the hold.
- Cap rate 12.8% vs local median 7.2% in Calverton — top-decile yield for the area; either an underpriced asset or a hidden risk that comps aren't pricing in. Stress-test before assuming the spread holds.
Questions for listing agent
- What does the HOA fee cover, when was the last increase, and are there any pending special assessments or reserve-fund shortfalls?
- Is there a deadline driving the sale (1031 exchange, divorce, estate, relocation)? That informs how much negotiation room exists.
- Schools are D-rated, which usually means shorter tenancies and higher turnover. Who's the typical renter profile here, and what's been the actual vacancy rate?
- What's the average days-on-market for RENTAL listings here right now (not sales)? A rising rental-DOM trend means longer vacancies and softer asking-rent achievability than the comps imply.
- What's the recent tenant-quality profile in this submarket — average credit score on applications, eviction rate, late-payment / NSF rate, and stable-employment percentage? A property-management company in the area should have these aggregated.
- How much new for-sale + rental construction is in the pipeline within 1–3 miles? Heavy new supply typically softens prices + rents 12–24 months out; constrained supply supports both.
CashFlowRE · CFR-G0NZBA490TPHA5
· Data 2 weeks ago
cashflowre.app · 2026-05-29