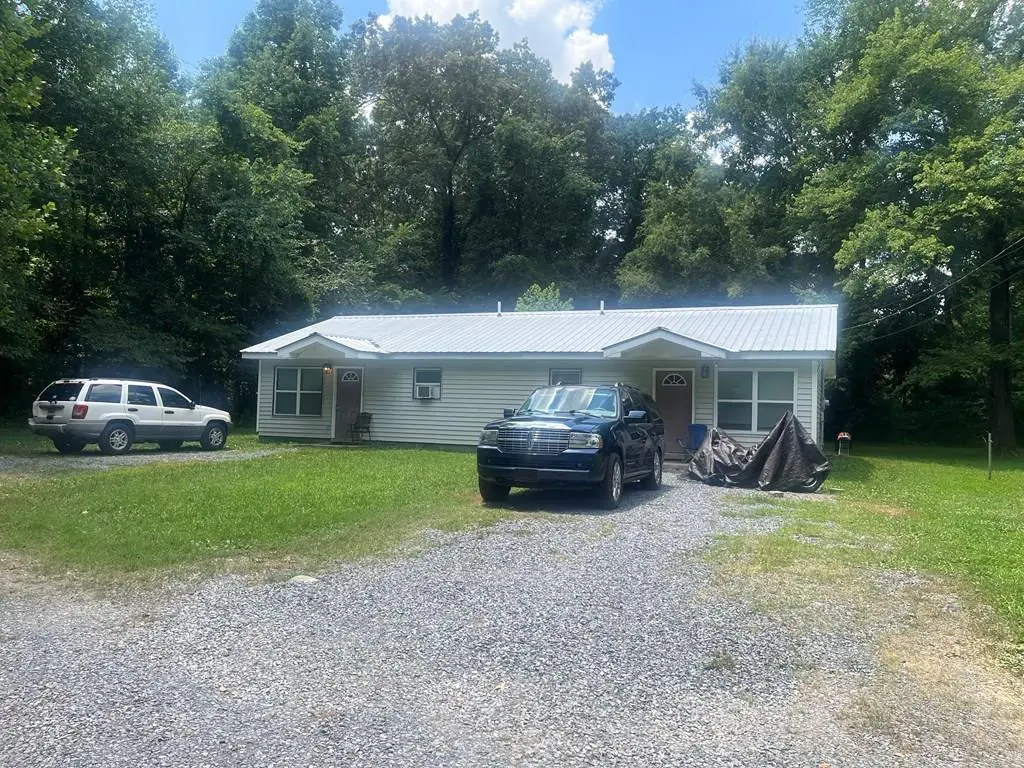
1222 Beaverdale Cutoff
Varnell, GA 30721
$765,000D
15 bd · 3.0 ba ·
1,456 sqft ·
Built 1990
· MultiFamily
· Active
· 15 DOM
Cashflow @ list (25.0% down · 7.5%)
Estimated rent
$6,797/mo
Mortgage (P&I)
−$4,012
Tax + insurance
−$1,014
HOA
−$0
Vac / Maint / Mgmt
−$1,427
Net cashflow
$344/mo
Annual
$4,128/yr
Cap rate
6.94%
Cash-on-cash
2.30%
DSCR
1.10
1% rule
0.89%
Cash to close
$214,200
Investor read
- This is a 5 × 3-bed/?-bath units multifamily listed at $765k.
- At list price, monthly cash flow is $344 ($4k/yr) — positive. Per door: $69/mo.
- The deal already cash-flows at list — no discount required.
- To meet the 1% rule (rent ≥ 1% of price), the offer needs to be $680k (11.2% below list).
- It's been on market 15 days — a 2% lower offer ($754k) is reasonable based on typical stale-listing flexibility.
- Recommended offer: $680k (11.2% below list) — sets the bar for 1% rule.
- Local home prices are declining (-3.0%/yr); year-one equity from $5k of loan paydown is wiped out by about $23k of value loss. Plan a longer hold.
- Location reads 64/100 on livability (#276 in GA) — a middle-class / working-renter tenant base. Strengths: crime A+, cost of living A+, housing A+; Watch: schools F, amenities F, commute F.
- Whitfield County (rural): math 37% / reading 34% proficiency, ranked #62 of 174 in GA (top 36%) — families likely to look elsewhere, expect single-tenant / working-renter base with shorter leases; 61% free/reduced lunch — lower-income household profile, screen leases tightly.
- Watch-outs: flood insurance adds $66/mo.
- Market conditions: 384 active listings in the ZIP; 374 units permitted in Whitfield County in 2024 (35 in 5+ unit buildings).
- Whitfield County population projected at +3% by 2050 — modest demand growth; plan on rents tracking national, not racing it.
- 3 sale attempts; this cycle's ask has dropped $85k (10%) from the opening price — seller is motivated, your offer sets the floor, not the list.
- Climate carrying-cost: severe flood risk; major wildfire risk; extreme-heat days projected 7→18/yr by 2055 (HVAC capex compounding) — expect insurance premiums to compound above CPI over the hold.
- Cap rate 6.9% vs local median 2.5% in Varnell — top-decile yield for the area; either an underpriced asset or a hidden risk that comps aren't pricing in. Stress-test before assuming the spread holds.
- At $6,797/mo this rent would consume 131% of the median local household income ($62k/yr) (locally 1156% of renters already pay >50% of income on rent) — very limited rent-growth headroom before tenants either downsize or default.
Questions for listing agent
- Can we see the unit-by-unit rent roll, current vacancy, and any below-market leases? What's the average tenancy length?
- What capital expenditures (roof, boiler, parking lot, exteriors) have been made in the last 5 years, and what's planned in the next 2?
- What's the actual annual flood-insurance premium (NFIP or private), and is the property in a SFHA with mandatory coverage?
- Is there a deadline driving the sale (1031 exchange, divorce, estate, relocation)? That informs how much negotiation room exists.
- Schools are F-rated, which usually means shorter tenancies and higher turnover. Who's the typical renter profile here, and what's been the actual vacancy rate?
- The area grade is low — what's the realistic commute time and amenity access for the typical tenant pool here? Any planned neighborhood developments (good or bad) we should know about?
- What's the average days-on-market for RENTAL listings here right now (not sales)? A rising rental-DOM trend means longer vacancies and softer asking-rent achievability than the comps imply.
- What's the recent tenant-quality profile in this submarket — average credit score on applications, eviction rate, late-payment / NSF rate, and stable-employment percentage? A property-management company in the area should have these aggregated.
CashFlowRE · CFR-G1X35R0MSNV8R2
· Data 1 day ago
cashflowre.app · 2026-05-29