 5-Plex
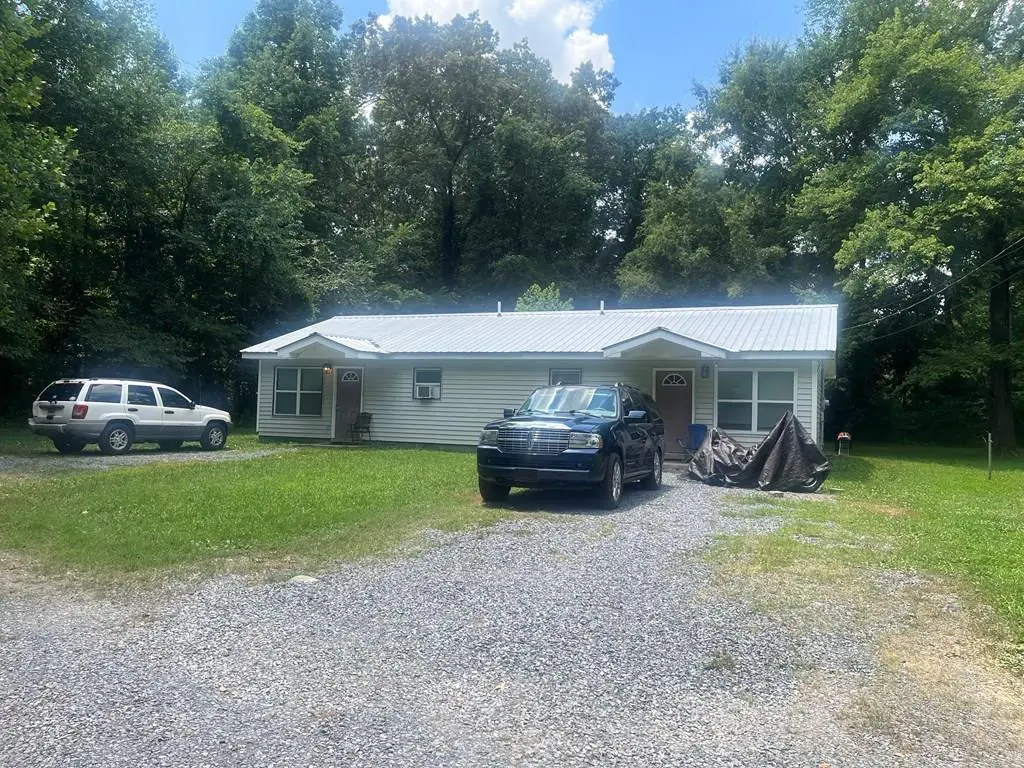
1222 Beaverdale Cutoff · Varnell, GA
Flood risk 8/10 · Major
- FEMA flood zone
- X (unshaded)
- Chance of flooding over 30 yrs
- 0.99%
- Est. flood insurance / yr
- $507 – $1,088
Fire risk 6/10 · Moderate
- Est. fire insurance / yr
- $963 – $1,789
Heat risk 6/10 · Moderate
- Hot days now (above 106°F)
- 7 days/yr
- Hot days in 30 yrs
- 18 days/yr
Wind risk 4/10 · Minor
- Chance of severe wind over 30 yrs
- 9.0%
Air-quality risk 3/10 · Minor
- Unhealthy air days now
- 2 days/yr
- Unhealthy air days in 30 yrs
- 3 days/yr
Risk factors via First Street. Map © Google.
Why this score? — see what drove the D grade
The composite is a weighted blend of 9 inputs, each scored 0–100. Each bar is that input's sub-score; the figure is the points it added to the 100-point composite (weight × sub-score).
- Cash flow +16.2/30.0
- ARV discount +7.5/15.0
- DSCR +5.0/10.0
- 1% rule +3.9/10.0
- Livability +3.2/5.0
- Schools +3.0/10.0
- Rent growth +2.5/5.0
- Condition / age +2.5/5.0
- Appreciation +0.0/10.0
$765,000
🖨 Deal sheet 📄 Offer letter ✓ Due diligence
Multi-family units
County records classify this as Multi-Family (2-4 Unit). Listing-text estimate: 5 units. estimate disagrees with records
Listing remarks MLS
Investor's Special! 4 Duplexes, 1 mobile home lots on 9.98 acres.
Key facts
- 9.98 acre lot
- Built 1990
- Listed 14 days
Neighborhood map
What this means for you Summary
Snapshot
- This is a 5 × 3-bed/?-bath units multifamily listed at $765k.
Deal economics
- At list price, monthly cash flow is $344 ($4k/yr) — positive. Per door: $69/mo.
- The deal already cash-flows at list — no discount required.
- To meet the 1% rule (rent ≥ 1% of price), the offer needs to be $680k (11.2% below list).
- Recommended offer: $680k (11.2% below list) — sets the bar for 1% rule.
- Cap rate 6.9% vs local median 2.5% in Varnell — top-decile yield for the area; either an underpriced asset or a hidden risk that comps aren't pricing in. Stress-test before assuming the spread holds.
Location & tenants
- Location reads 64/100 on livability (#276 in GA) — a middle-class / working-renter tenant base. Strengths: crime A+, cost of living A+, housing A+; Watch: schools F, amenities F, commute F.
- Whitfield County (rural): math 37% / reading 34% proficiency, ranked #62 of 174 in GA (top 36%) — families likely to look elsewhere, expect single-tenant / working-renter base with shorter leases; 61% free/reduced lunch — lower-income household profile, screen leases tightly.
- Market conditions: 384 active listings in the ZIP; 374 units permitted in Whitfield County in 2024 (35 in 5+ unit buildings).
- At $6,797/mo this rent would consume 131% of the median local household income ($62k/yr) (locally 1156% of renters already pay >50% of income on rent) — very limited rent-growth headroom before tenants either downsize or default.
Forward outlook
- Local home prices are declining (-3.0%/yr); year-one equity from $5k of loan paydown is wiped out by about $23k of value loss. Plan a longer hold.
- Whitfield County population projected at +3% by 2050 — modest demand growth; plan on rents tracking national, not racing it.
Negotiation context
- It's been on market 15 days — a 2% lower offer ($754k) is reasonable based on typical stale-listing flexibility.
- 3 sale attempts; this cycle's ask has dropped $85k (10%) from the opening price — seller is motivated, your offer sets the floor, not the list.
Risks & watch-outs
- Watch-outs: flood insurance adds $66/mo.
- Climate carrying-cost: severe flood risk; major wildfire risk; extreme-heat days projected 7→18/yr by 2055 (HVAC capex compounding) — expect insurance premiums to compound above CPI over the hold.
Questions for the listing agent
- Can we see the unit-by-unit rent roll, current vacancy, and any below-market leases? What's the average tenancy length?
- What capital expenditures (roof, boiler, parking lot, exteriors) have been made in the last 5 years, and what's planned in the next 2?
- What's the actual annual flood-insurance premium (NFIP or private), and is the property in a SFHA with mandatory coverage?
- Is there a deadline driving the sale (1031 exchange, divorce, estate, relocation)? That informs how much negotiation room exists.
- Schools are F-rated, which usually means shorter tenancies and higher turnover. Who's the typical renter profile here, and what's been the actual vacancy rate?
- The area grade is low — what's the realistic commute time and amenity access for the typical tenant pool here? Any planned neighborhood developments (good or bad) we should know about?
- What's the average days-on-market for RENTAL listings here right now (not sales)? A rising rental-DOM trend means longer vacancies and softer asking-rent achievability than the comps imply.
- What's the recent tenant-quality profile in this submarket — average credit score on applications, eviction rate, late-payment / NSF rate, and stable-employment percentage? A property-management company in the area should have these aggregated.
- How much new apartment / multifamily construction is in the pipeline within 1–3 miles? Heavy new supply (>2% of stock underway) typically softens rents 12–24 months out; light construction supports rent growth.
Investment metrics
- 1% rule
- 0.89% ✗
- Cap rate
- 6.94%
- Cash-on-cash
- 2.30%
- DSCR
- 1.10
- GRM
- 9.4
CMA / ARV
No comps found within radius.
Projected returns pro-forma
-3.0% appreciation · 3.0% rent growth · sell at horizon
- IRR
- -13.2%
- Equity multiple
- 0.52×
- Total profit
- $-102,114
- Equity at exit
- $114,064
- IRR
- -4.3%
- Equity multiple
- 0.72×
- Total profit
- $-60,945
- Equity at exit
- $66,143
Cash invested: $214,200 (down + closing). Projections, not guarantees.
Landlord ↔ Tenant lean methodology
- Overall (STATE)
- 90 Strongly Landlord-Friendly
- State Georgia
- 90 Strongly Landlord-Friendly · R+3
- County
- — inherits STATE
- City
- — inherits STATE
ZIP-level market 30721
- Active inventory
- 384
- Price-to-rent
- 46.9×
Monthly cashflow live
- Estimated rent
- $6,797 medium interval (Pro) →
- Mortgage (P&I)
- −$4,012
- Tax from tax record
- −$629 /mo · $7,545/yr
- Insurance
- −$319
- Flood insurance flood zone
- −$66 /mo · $798/yr
- HOA
- −$0
- Vacancy / Maint / Mgmt
- −$1,427
- Net cashflow
- $344
Break-even live
5-unit breakdown (identical units grouped — click to expand)
| Units | Beds | Baths | Est. rent |
|---|---|---|---|
| 5× units | 3 | — | $6,795 |
| #1 | 3 | — | $1,359 |
| #2 | 3 | — | $1,359 |
| #3 | 3 | — | $1,359 |
| #4 | 3 | — | $1,359 |
| #5 | 3 | — | $1,359 |
| Total (5 units) | $6,797 | ||
UW: 25.0% down · 7.5% · 30yr · 1.5% tax · 5.0% vac · 8.0% maint · 8.0% mgmt
Financing live
Cash to close
- Down payment
- $191,250
- Closing costs
- $22,950
- Reserves months
- —
- Total cash needed
- —
Loan-product check · same deal, 3 products live
Conventional
25% down · 7.5% · 30yr
- Down + closing
- —
- Monthly P&I
- —
- Monthly cashflow
- —
- DSCR
- —
- Eligible?
- —
Personal DTI + credit; lowest rate.
DSCR
20% down · 8.5% · 30yr
- Down + closing
- —
- Monthly P&I
- —
- Monthly cashflow
- —
- DSCR
- —
- Eligible?
- —
No personal income docs; deal must DSCR.
Hard money
10% down · 12.0% · 12mo
- Down + closing
- —
- Monthly P&I
- —
- Monthly cashflow
- —
- DSCR
- —
- Eligible?
- —
Short-term bridge; refi at stabilization.
Listing history 24 events
-
2026-06-19days on market $765,000 Active 15 DOM
-
2026-06-18days on market $765,000 Active 14 DOM
-
2026-06-17days on market $765,000 Active 13 DOM
-
2026-06-16days on market $765,000 Active 12 DOM
-
2026-06-15days on market $765,000 Active 11 DOM
-
2026-06-14days on market $765,000 Active 9 DOM
-
2026-06-13days on market $765,000 Active 8 DOM
-
2026-06-10days on market $765,000 Active 6 DOM
-
2026-06-09days on market $765,000 Active 5 DOM
-
2026-06-08days on market $765,000 Active 4 DOM
-
2026-06-07days on market $765,000 Active 3 DOM
-
2026-06-05pricedays on market $765,000 Active 1 DOM
-
2026-06-03days on market $795,000 Active 276 DOM
-
2026-06-02days on market $795,000 Active 275 DOM
-
2026-06-01days on market $795,000 Active 274 DOM
-
2026-05-31days on market $795,000 Active 273 DOM
-
2026-05-30days on market $795,000 Active 272 DOM
-
2026-01-12status Active 65-char remark
Show marketing remark (65 chars)
Investor's Special! 4 Duplexes, 1 mobile home lots on 9.98 acres.
-
2026-01-12price $795,000 65-char remark
Show marketing remark (65 chars)
Investor's Special! 4 Duplexes, 1 mobile home lots on 9.98 acres.
-
2025-10-27price $798,900 65-char remark
Show marketing remark (65 chars)
Investor's Special! 4 Duplexes, 1 mobile home lots on 9.98 acres.
-
2025-10-13price $825,000 65-char remark
Show marketing remark (65 chars)
Investor's Special! 4 Duplexes, 1 mobile home lots on 9.98 acres.
-
2025-08-28$850,000 Active 65-char remark
Show marketing remark (65 chars)
Investor's Special! 4 Duplexes, 1 mobile home lots on 9.98 acres.
-
2025-07-21status Pending
-
2025-07-14$850,000 Active
ⓘ Source: listings_history table (triggers on properties + properties_extension) + one-shot
backfill from property_details.listing_events for pre-trigger history.
Tax reassessment forecast GA · Resets to sale price
- Current annual tax
- $7,545 · $629/mo
- Projected year-2 tax
- $7,545 · $629/mo
- Expected delta
- $0/yr ($0/mo · 0.0%)
ⓘ Screening estimate from a state-policy table — verify with the county assessor before closing.
Climate risk First Street
- Flood 8/10 Severe FEMA zone X (unshaded) · 99% chance over 30 yrs
- Wildfire 6/10 Major
- Heat 6/10 Major 7 d/yr ≥106°F today · 18 d/yr by 30 yrs out
- Wind 4/10 Moderate 9% chance of damaging wind over 30 yrs
- Air quality 3/10 Moderate 2 unhealthy d/yr today · 3 by 30 yrs out
Nearby sold comps map
Loading sold comps map…
Walkable amenities ~0.75 mi
Loading nearby amenities…
Taxation est. · year 1
- Rental income
- $81,564
- − Mortgage interest
- −$42,852
- − Property taxes
- −$7,545
- − Insurance
- −$4,622
- − Repairs & maintenance
- −$6,525
- − Management
- −$6,525
- − Depreciation
- −$22,255
- Taxable loss
- −$8,760
- Est. tax savings @ 24.0%
- +$2,102
- After-tax cash flow
- $6,230/yr
For passive investors: Depreciation is non-cash, so a rental often shows a tax loss while cash-flowing — sheltering income. Rental losses are passive: they offset passive income freely, and up to $25,000/yr can offset ordinary (W-2) income if you actively participate and your MAGI is under $100k (phasing out to $0 by $150k); unused losses carry forward. On sale, claimed depreciation is recaptured at up to 25%, and gains may owe capital-gains tax (a 1031 exchange can defer both). Figures are a year-1 estimate at your 24.0% rate — not tax advice; consult a CPA.
Schools (NCES district)
- District
- Whitfield County
- NCES district ID
- 1305700
- Math proficiency
- 37% ▼ -6.00%
- Reading proficiency
- 34% ▼ -9.00%
- Median HH income
- $44,296
- Composite
- 30.24/100
- National rank
- #6290
- State rank
- #62 of 174 in GA
Livability — Varnell
- Score
- 64/100
- State rank
- #276
- US rank
- #14823
Category grades
Schools grade is shown separately in the Schools card above.
Census & demographics
- County
- Whitfield County · 80,309 people
- City population
- 3
- Metro
- Dalton, GA
- Population (ZIP)
- 53,060
- Household income
- $62,094
- Rent vs Own
- Severe rent burden
- 1156.0
Population outlook (Whitfield County) Hauer SSP2
- Today (2025)
- 107,770 people
- By 2030
- 108,737 · +0.9%
- By 2040
- 110,260 · +2.3%
- By 2050
- 111,205 · +3.2%
- By 2075
- 113,014 · +4.9%
- By 2100
- 112,775 · +4.6%
Race, ethnicity, and origin ACS 2023
- Neighborhood character
- Diverse neighborhood (Simpson 0.55)
- Race & ethnicity
- White 48% Hispanic / Latino 47% Two or more races 10% Black 4% Native American 1%
- Hispanic origin (detail)
- Mexican 35% Cuban 1%
- Common ancestry
- Slovak 1% Italian 1%
- Foreign-born
- 24% · Canada, Jamaica
- Languages at home
- 62% English-only · Spanish 37%
Political lean MEDSL · Whitfield
- 2024 margin
- Solid R (+44.5) · D 27.5% · R 72.0%
- 2008→2024 swing
- -4.5pp toward R · 2008: -40.0pp · 2024: -44.5pp
- All cycles
- 2024: R+44.5 2020: R+40.7 2016: R+44.8 2012: R+45.1 2008: R+40.0
Not yet ingested
- Civics
- —
Market trends
- HPI YoY
- ▼ -220.10%
- Current HPI
- 314.9341
- Rent YoY
- —
- Metro
- Dalton, GA
- State GDP YoY
- ▲ 2.66%
- F500 in state
- 28
Industry mix (Fortune 500 HQ in GA)
| Industry | F500 HQs | Revenue |
|---|---|---|
| Paper / Packaging | 2 | $29B |
|
||
| Retail | 1 | $160B |
|
||
| Transportation / Logistics | 1 | $91B |
|
||
| Airlines | 1 | $62B |
|
||
| Consumer Goods | 1 | $47B |
|
||
| Utilities | 1 | $25B |
|
||
Price history
-6.5% since first listed7 events — show timeline
- 2026-01-12 Relisted — CCARMLS
- 2026-01-12 Price Changed $795,000 CCARMLS
- 2025-10-27 Price Changed $798,900 CCARMLS
- 2025-10-13 Price Changed $825,000 CCARMLS
- 2025-08-28 Listed $850,000 CCARMLS
- 2025-07-21 Pending — CCARMLS
- 2025-07-14 Listed $850,000 CCARMLS
Property tax history
+10.0%/yrLatest (2025): $7,545 · +56.4% YoY. Source: county tax records.
Cash-flow waterfall
monthlySold comps — $/sqft
last 12 mo · ≤1 miLoading sold comps…