1080 Jack Calhoun Dr Lot 165
Kissimmee, FL 34741
$70,000B-
2 bd · 2.0 ba ·
1,100 sqft ·
Built 1996
· Manufactured
· Active
· 48 DOM
Cashflow @ list (25.0% down · 7.5%)
Estimated rent
$1,691/mo
Mortgage (P&I)
−$367
Tax + insurance
−$117
HOA
−$0
Vac / Maint / Mgmt
−$355
Net cashflow
$852/mo
Annual
$10,227/yr
Cap rate
20.90%
Cash-on-cash
52.18%
DSCR
3.32
1% rule
2.42%
Cash to close
$19,600
Investor read
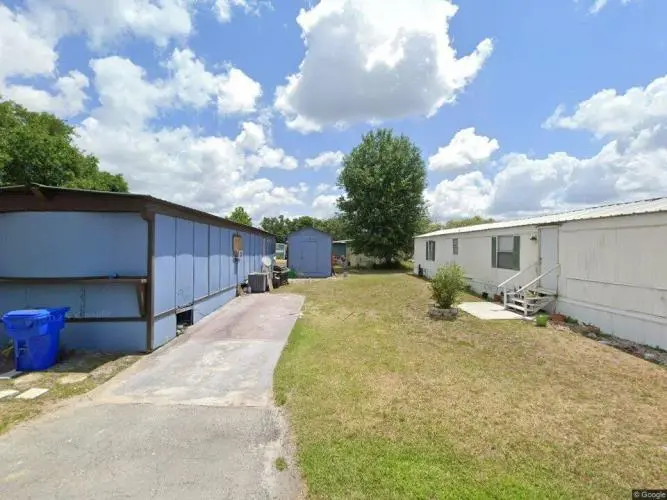
- This is a 2-bed/2.0-bath manufactured listed at $70k. Condition is rated fair.
- At list price, monthly cash flow is $852 ($10k/yr) — positive.
- The deal already cash-flows at list — no discount required.
- Meets the 1% rule at list price ($2k rent vs $70k).
- It's been on market 48 days — a 3% lower offer ($68k) is reasonable based on typical stale-listing flexibility.
- Recommended offer: $68k (3.0% below list) — sets the bar for market timing.
- Local home prices are declining (-3.0%/yr); year-one equity from $484 of loan paydown is wiped out by about $2k of value loss. Plan a longer hold.
- Location reads 77/100 on livability (#181 in FL, #2,841 nationally) — a middle-class / working-renter tenant base. Strengths: commute A+, housing A+, health & safety A+; Watch: schools C-, crime D-, employment D-.
- Osceola (suburban): math 39% / reading 45% proficiency, ranked #60 of 73 in FL (top 82%) — families likely to look elsewhere, expect single-tenant / working-renter base with shorter leases; 60% free/reduced lunch — lower-income household profile, screen leases tightly.
- Market conditions: Rents soft (-1.4%/yr); 376 active listings in the ZIP; 13 comparable units currently listed for rent nearby; rentals at typical pace (median 18d on market — plan ~3-4 weeks tenant-placement turnaround); 8,813 units permitted in Osceola County in 2024 (3,072 in 5+ unit buildings).
- Osceola County population projected at +73% by 2050 — long-run rental-demand tailwind backs the buy-and-hold thesis.
- At projected returns (-3.0% appreciation + 0.0% rent growth), your $20k cash investment doubles in ~3 years — after that, you're playing with house money.
- Climate carrying-cost: severe wind risk, 99% chance of damaging wind over 30y; extreme-heat days projected 7→23/yr by 2055 (HVAC capex compounding) — expect insurance premiums to compound above CPI over the hold.
- Cap rate 20.9% vs local median 3.5% in Kissimmee — top-decile yield for the area; either an underpriced asset or a hidden risk that comps aren't pricing in. Stress-test before assuming the spread holds.
- This rent runs 39% of the median local income ($52k/yr) — at the standard rent-burdened threshold; future hikes will face affordability resistance.
Questions for listing agent
- It's been on market 48 days. Have you received any prior offers? Is the seller open to a 3% concession, seller financing, or rate buy-down credit?
- Have any recent inspections been done? Can we get a copy of the seller's disclosures and any deferred-maintenance estimates?
- Is there a deadline driving the sale (1031 exchange, divorce, estate, relocation)? That informs how much negotiation room exists.
- Crime grade is D in this area — have there been break-ins, vandalism, or insurance claims at this property in the last 3 years? What carrier currently insures it and at what premium?
- What's the average days-on-market for RENTAL listings here right now (not sales)? A rising rental-DOM trend means longer vacancies and softer asking-rent achievability than the comps imply.
- What's the recent tenant-quality profile in this submarket — average credit score on applications, eviction rate, late-payment / NSF rate, and stable-employment percentage? A property-management company in the area should have these aggregated.
- How much new for-sale + rental construction is in the pipeline within 1–3 miles? Heavy new supply typically softens prices + rents 12–24 months out; constrained supply supports both.
Repairs flagged (vision-AI assessment)
- Minor: exterior siding — Slight weathering
- Minor: landscaping — Low grass and debris
CashFlowRE · CFR-G33GJR2Z280C7B
· Data 2 days ago
cashflowre.app · 2026-05-29