 🏷️ Likely Rental
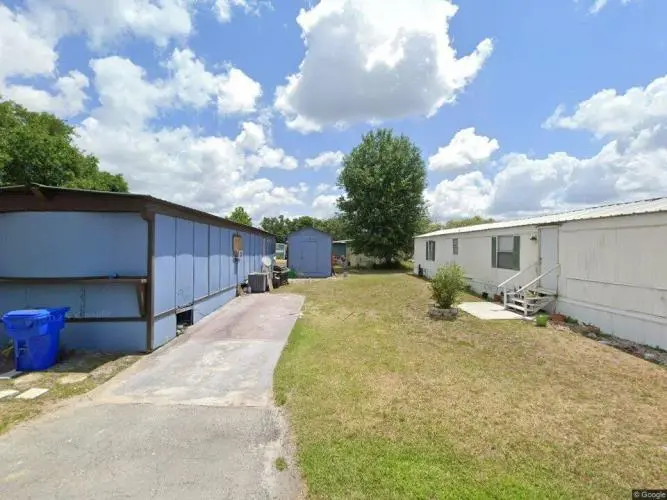
1080 Jack Calhoun Dr Lot 165 · Kissimmee, FL
Flood risk 1/10 · Minimal
- FEMA flood zone
- X (unshaded)
- Chance of flooding over 30 yrs
- 0.0%
- Est. flood insurance / yr
- $507 – $1,088
Fire risk 4/10 · Minor
- Est. fire insurance / yr
- $947 – $1,759
Heat risk 8/10 · Major
- Hot days now (above 108°F)
- 7 days/yr
- Hot days in 30 yrs
- 23 days/yr
Wind risk 9/10 · Severe
- Chance of severe wind over 30 yrs
- 99.0%
Air-quality risk 1/10 · Minimal
- Unhealthy air days now
- 0 days/yr
- Unhealthy air days in 30 yrs
- 0 days/yr
Risk factors via First Street. Map © Google.
Why this score? — see what drove the B- grade
The composite is a weighted blend of 9 inputs, each scored 0–100. Each bar is that input's sub-score; the figure is the points it added to the 100-point composite (weight × sub-score).
- Cash flow +30.0/30.0
- 1% rule +10.0/10.0
- DSCR +10.0/10.0
- ARV discount +7.5/15.0
- Livability +3.9/5.0
- Schools +3.6/10.0
- Rent growth +2.1/5.0
- Condition / age +2.0/5.0
- Appreciation +0.0/10.0
$70,000
🖨 Deal sheet 📄 Offer letter ✓ Due diligence
Listing remarks
2 bed 2 bath mobile home Family / Pet friendly park. $700.00 per month lot rent. 2 storage sheds. Brand new central air installed 4/25/2026 Will consider offers.
Key facts
- Storage sheds
- Built 1996
- Listed 48 days
Tags
Neighborhood map
What this means for you Summary
Snapshot
- This is a 2-bed/2.0-bath manufactured listed at $70k. Condition is rated fair.
Deal economics
- At list price, monthly cash flow is $852 ($10k/yr) — positive.
- The deal already cash-flows at list — no discount required.
- Meets the 1% rule at list price ($2k rent vs $70k).
- Recommended offer: $68k (3.0% below list) — sets the bar for market timing.
- Cap rate 20.9% vs local median 3.5% in Kissimmee — top-decile yield for the area; either an underpriced asset or a hidden risk that comps aren't pricing in. Stress-test before assuming the spread holds.
Location & tenants
- Location reads 77/100 on livability (#181 in FL, #2,841 nationally) — a middle-class / working-renter tenant base. Strengths: commute A+, housing A+, health & safety A+; Watch: schools C-, crime D-, employment D-.
- Osceola (suburban): math 39% / reading 45% proficiency, ranked #60 of 73 in FL (top 82%) — families likely to look elsewhere, expect single-tenant / working-renter base with shorter leases; 60% free/reduced lunch — lower-income household profile, screen leases tightly.
- Market conditions: Rents soft (-1.4%/yr); 376 active listings in the ZIP; 13 comparable units currently listed for rent nearby; rentals at typical pace (median 18d on market — plan ~3-4 weeks tenant-placement turnaround); 8,813 units permitted in Osceola County in 2024 (3,072 in 5+ unit buildings).
- This rent runs 39% of the median local income ($52k/yr) — at the standard rent-burdened threshold; future hikes will face affordability resistance.
Forward outlook
- Local home prices are declining (-3.0%/yr); year-one equity from $484 of loan paydown is wiped out by about $2k of value loss. Plan a longer hold.
- Osceola County population projected at +73% by 2050 — long-run rental-demand tailwind backs the buy-and-hold thesis.
- At projected returns (-3.0% appreciation + 0.0% rent growth), your $20k cash investment doubles in ~3 years — after that, you're playing with house money.
Negotiation context
- It's been on market 48 days — a 3% lower offer ($68k) is reasonable based on typical stale-listing flexibility.
Risks & watch-outs
- Climate carrying-cost: severe wind risk, 99% chance of damaging wind over 30y; extreme-heat days projected 7→23/yr by 2055 (HVAC capex compounding) — expect insurance premiums to compound above CPI over the hold.
Questions for the listing agent
- It's been on market 48 days. Have you received any prior offers? Is the seller open to a 3% concession, seller financing, or rate buy-down credit?
- Have any recent inspections been done? Can we get a copy of the seller's disclosures and any deferred-maintenance estimates?
- Is there a deadline driving the sale (1031 exchange, divorce, estate, relocation)? That informs how much negotiation room exists.
- Crime grade is D in this area — have there been break-ins, vandalism, or insurance claims at this property in the last 3 years? What carrier currently insures it and at what premium?
- What's the average days-on-market for RENTAL listings here right now (not sales)? A rising rental-DOM trend means longer vacancies and softer asking-rent achievability than the comps imply.
- What's the recent tenant-quality profile in this submarket — average credit score on applications, eviction rate, late-payment / NSF rate, and stable-employment percentage? A property-management company in the area should have these aggregated.
- How much new for-sale + rental construction is in the pipeline within 1–3 miles? Heavy new supply typically softens prices + rents 12–24 months out; constrained supply supports both.
Investment metrics
- 1% rule
- 2.42% ✓
- Cap rate
- 20.90%
- Cash-on-cash
- 52.18%
- DSCR
- 3.32
- GRM
- 3.4
CMA / ARV
- ARV (on-the-fly)
- $254,100
- Comps found
- 1
Show comp detail 1 sale within ~0.75 mi
| Address | Dist | Beds/Ba | Sqft | Sold | Price | $/sf | Match |
|---|---|---|---|---|---|---|---|
| 1112 Dara Cay Dr | 0.45mi | 3/2.0 (+1) | 960 (-13%) | 12mo | $222,000 | $231 | 43 |
Match score weights: distance 35% · size 25% · config 20% · recency 20%. Top-matched comps best support the ARV.
Projected returns pro-forma
-3.0% appreciation · 0.0% rent growth · sell at horizon
- IRR
- 46.7%
- Equity multiple
- 2.94×
- Total profit
- $38,008
- Equity at exit
- $10,437
- IRR
- 51.1%
- Equity multiple
- 5.28×
- Total profit
- $83,944
- Equity at exit
- $6,052
Cash invested: $19,600 (down + closing). Projections, not guarantees.
Landlord ↔ Tenant lean methodology
- Overall (STATE)
- 87 Strongly Landlord-Friendly
- State Florida
- 87 Strongly Landlord-Friendly · R+3
- County
- — inherits STATE
- City
- — inherits STATE
ZIP-level market 34741
- Home prices YoY
- -28.3%
- Rents YoY
- -1.4%
- Active inventory
- 376
- Price-to-rent
- 3.4×
Monthly cashflow live
- Estimated rent
- $1,691 high interval (Pro) →
- Mortgage (P&I)
- −$367
- Tax est. 1.5%
- −$88 /mo · $1,050/yr
- Insurance
- −$29
- HOA
- −$0
- Vacancy / Maint / Mgmt
- −$355
- Net cashflow
- $852
Break-even live
UW: 25.0% down · 7.5% · 30yr · 1.5% tax · 5.0% vac · 8.0% maint · 8.0% mgmt
Financing live
Cash to close
- Down payment
- $17,500
- Closing costs
- $2,100
- Reserves months
- —
- Total cash needed
- —
Loan-product check · same deal, 3 products live
Conventional
25% down · 7.5% · 30yr
- Down + closing
- —
- Monthly P&I
- —
- Monthly cashflow
- —
- DSCR
- —
- Eligible?
- —
Personal DTI + credit; lowest rate.
DSCR
20% down · 8.5% · 30yr
- Down + closing
- —
- Monthly P&I
- —
- Monthly cashflow
- —
- DSCR
- —
- Eligible?
- —
No personal income docs; deal must DSCR.
Hard money
10% down · 12.0% · 12mo
- Down + closing
- —
- Monthly P&I
- —
- Monthly cashflow
- —
- DSCR
- —
- Eligible?
- —
Short-term bridge; refi at stabilization.
Rent comps 13 comps
| Address | Beds | Baths | Sqft | Rent | $/sqft | DOM | Units | Dist |
|---|---|---|---|---|---|---|---|---|
| 1089 Greenskeep Dr Kissimmee, FL | 2.0 | 1.0 | 1428 | $1,600 | $1.12 | 23d | 1 | 0.25mi |
| 3201 W Pershing St Unit 3223 Kissimmee, FL | 2.0 | 1.0 | 830 | $1,525 | $1.84 | 7d | 1 | 0.29mi |
| 3201 Pershing St Unit 3207 Kissimmee, FL | 2.0 | 1.0 | 830 | $1,525 | $1.84 | 1d | 1 | 0.29mi |
| 851 Jenkins St Kissimmee, FL | 3.0 | 1.0 | 1426 | $1,750 | $1.23 | 23d | 1 | 0.83mi |
| 2112 W Martin St Kissimmee, FL | 2.0 | 2.0 | 1023 | $1,595 | $1.56 | 14d | 1 | 0.91mi |
| 701 7th Ave Kissimmee, FL | 3.0 | 1.0 | 1056 | $1,795 | $1.70 | 23d | 1 | 1.21mi |
| 1375 Oak Haven Dr Kissimmee, FL | 1.0–3.0 | 1.0–2.0 | 1102 | $2,168 | $1.97 | 2d | 27 | 1.28mi |
| 1416 Osceola Park Dr Kissimmee, FL | 3.0 | 2.0 | 1378 | $2,300 | $1.67 | 23d | 1 | 1.28mi |
| 1991 Estancia Cir Unit 16A Kissimmee, FL | 2.0 | 2.0 | 1260 | $1,750 | $1.39 | 23d | 1 | 1.34mi |
| 1985 Estancia Cir Unit A Kissimmee, FL | 2.0 | 2.0 | 1259 | $1,549 | $1.23 | 23d | 1 | 1.35mi |
| 801 Green Heron Ct Kissimmee, FL | 1.0–3.0 | 1.0–2.0 | 975 | $1,676 | $1.72 | 2d | 9 | 1.41mi |
| 2830 Osprey Cove Pl #204 Kissimmee, FL | 3.0 | 2.0 | 1136 | $1,500 | $1.32 | 17d | 1 | 1.47mi |
| 900 Woodside Cir Kissimmee, FL | 1.0–3.0 | 1.0–2.5 | 1030 | $1,760 | $1.71 | 1d | 26 | 1.49mi |
Listing history 15 events
-
2026-06-18days on market $70,000 Active 48 DOM
-
2026-06-17days on market $70,000 Active 47 DOM
-
2026-06-16days on market $70,000 Active 46 DOM
-
2026-06-15days on market $70,000 Active 45 DOM
-
2026-06-13days on market $70,000 Active 43 DOM
-
2026-06-13days on market $70,000 Active 42 DOM
-
2026-06-10days on market $70,000 Active 39 DOM
-
2026-06-08days on market $70,000 Active 38 DOM
-
2026-06-07days on market $70,000 Active 37 DOM
-
2026-06-04days on market $70,000 Active 34 DOM
-
2026-06-03days on market $70,000 Active 33 DOM
-
2026-06-02days on market $70,000 Active 32 DOM
-
2026-06-02days on market $70,000 Active 31 DOM
-
2026-05-31days on market $70,000 Active 30 DOM
-
2026-04-30$70,000 Active
ⓘ Source: listings_history table (triggers on properties + properties_extension) + one-shot
backfill from property_details.listing_events for pre-trigger history.
Climate risk First Street
- Flood 1/10 Low FEMA zone X (unshaded) · 0% chance over 30 yrs
- Wildfire 4/10 Moderate
- Heat 8/10 Severe 7 d/yr ≥108°F today · 23 d/yr by 30 yrs out
- Wind 9/10 Extreme 99% chance of damaging wind over 30 yrs
- Air quality 1/10 Low 0 unhealthy d/yr today · 0 by 30 yrs out
Nearby sold comps map
Loading sold comps map…
Walkable amenities ~0.75 mi
Loading nearby amenities…
Taxation est. · year 1
- Rental income
- $20,294
- − Mortgage interest
- −$3,921
- − Property taxes
- −$1,050
- − Insurance
- −$350
- − Repairs & maintenance
- −$1,624
- − Management
- −$1,624
- − Depreciation
- −$2,036
- Taxable income
- $9,690
- Est. tax owed @ 24.0%
- −$2,326
- After-tax cash flow
- $7,902/yr
For passive investors: Depreciation is non-cash, so a rental often shows a tax loss while cash-flowing — sheltering income. Rental losses are passive: they offset passive income freely, and up to $25,000/yr can offset ordinary (W-2) income if you actively participate and your MAGI is under $100k (phasing out to $0 by $150k); unused losses carry forward. On sale, claimed depreciation is recaptured at up to 25%, and gains may owe capital-gains tax (a 1031 exchange can defer both). Figures are a year-1 estimate at your 24.0% rate — not tax advice; consult a CPA.
Condition & rehab AI · 1 photo
This mobile home has average condition with some cosmetic repairs needed. Painting the exterior and landscaping would significantly improve its curb appeal and value.
Repairs flagged
- Minor exterior siding — Slight weathering
- Minor landscaping — Low grass and debris
Value-add opportunities
- Both paint exterior walls — Enhances curb appeal and resale value
- Both landscape and add curb appeal — Improves curb appeal and rental value
- Both repair and paint exterior siding — Fixes weathered appearance and enhances resale value
Renovation cost estimate screening
| Repair item | Severity | Est. cost |
|---|---|---|
| exterior siding · Slight weathering | Minor | $500–3,000 |
| landscaping · Low grass and debris | Minor | $500–3,000 |
| Total estimated repair cost · 2 items | $1,000–6,000 |
Value-add ROI direction
- Both paint exterior walls — Enhances curb appeal and resale value ↑
- Both landscape and add curb appeal — Improves curb appeal and rental value ↑
- Both repair and paint exterior siding — Fixes weathered appearance and enhances resale value ↑
ⓘ Cost ranges are severity-bucket heuristics (US national rule-of-thumb). Get contractor quotes + a written scope before underwriting a rehab budget.
Schools (NCES district)
- District
- Osceola
- NCES district ID
- 1201470
- Math proficiency
- 39% ▼ -9.00%
- Reading proficiency
- 45% ▼ -4.00%
- Median HH income
- $45,528
- Composite
- 35.7/100
- National rank
- #4865
- State rank
- #60 of 73 in FL
Livability — Kissimmee
- Score
- 77/100
- State rank
- #181
- US rank
- #2841
Category grades
Schools grade is shown separately in the Schools card above.
Census & demographics
- Census place
- Kissimmee, FL
- County
- Osceola County · 410,217 people
- City population
- 196,187
- Metro
- Orlando-Kissimmee-Sanford, FL
- Population (ZIP)
- 58,716
- Household income
- $52,409
- Rent vs Own
- Severe rent burden
- 5248.0
Population outlook (Osceola County) Hauer SSP2
- Today (2025)
- 447,624 people
- By 2030
- 511,823 · +14.3%
- By 2040
- 642,986 · +43.6%
- By 2050
- 774,552 · +73.0%
- By 2075
- 1,078,144 · +140.9%
- By 2100
- 1,269,660 · +183.6%
Race, ethnicity, and origin ACS 2023
- Neighborhood character
- Predominantly Hispanic (72%)
- Race & ethnicity
- Hispanic / Latino 72% Two or more races 20% White 16% Black 6% Asian 3%
- Hispanic origin (detail)
- Mexican 3% Puerto Rican 26% Cuban 4% Dominican 6%
- Common ancestry
- Estonian 1% Russian 1% Lithuanian 1%
- Foreign-born
- 39% · Canada, Jamaica
- Languages at home
- 27% English-only · Spanish 66% Other Indo-European 2% Arabic 2%
Political lean MEDSL · Osceola
- 2024 margin
- Toss-up / Even · D 48.7% · R 50.2% · Other 1.1%
- 2008→2024 swing
- -21.2pp toward R · 2008: 19.7pp · 2024: -1.4pp
- All cycles
- 2024: R+1.4 2020: D+13.8 2016: D+25.0 2012: D+24.5 2008: D+19.7
Not yet ingested
- Civics
- —
Market trends
- HPI YoY
- ▼ -115.96%
- Current HPI
- 293.3914
- Rent YoY
- ▼ -1.43%
- Metro
- Orlando-Kissimmee-Sanford, FL
- State GDP YoY
- ▲ 3.28%
- F500 in state
- 36
Industry mix (Fortune 500 HQ in FL)
| Industry | F500 HQs | Revenue |
|---|---|---|
| Industrial Technology | 2 | $29B |
|
||
| Insurance | 2 | $17B |
|
||
| Retail | 1 | $60B |
|
||
| Technology Distribution | 1 | $58B |
|
||
| Homebuilding | 1 | $35B |
|
||
| Technology Manufacturing | 1 | $35B |
|
||
Price history
1 event — show timeline
- 2026-04-30 Listed $70,000 Fizber.com
Cash-flow waterfall
monthlySold comps — $/sqft
last 12 mo · ≤1 miLoading sold comps…