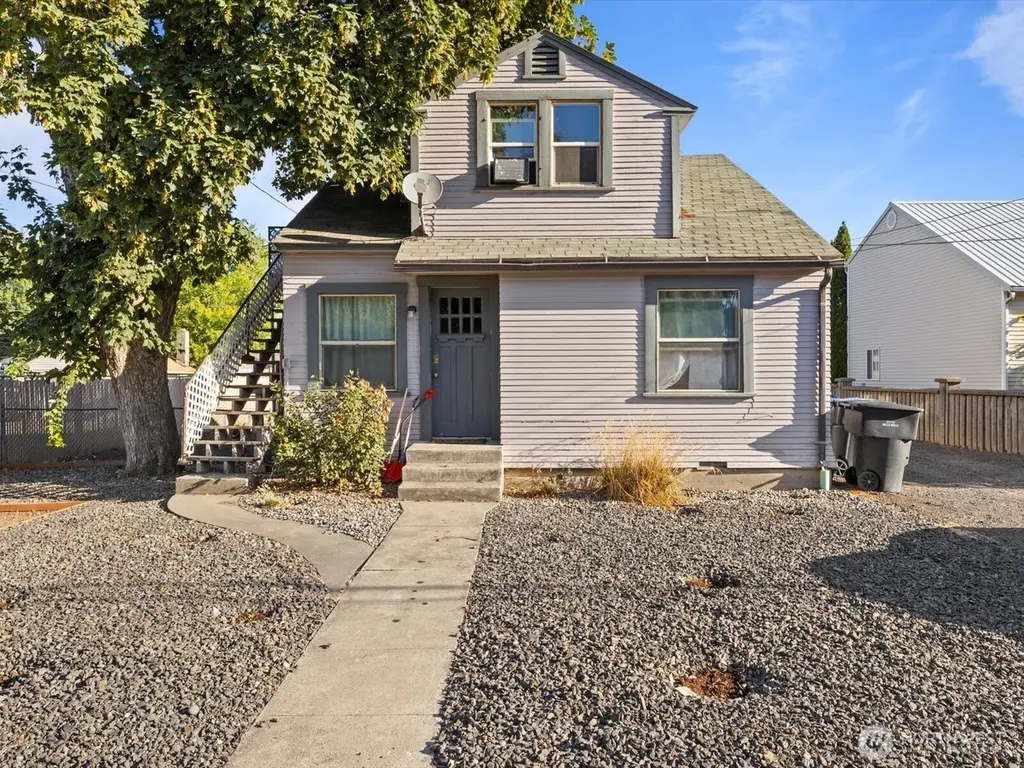
1813 Pleasant St
Walla Walla, WA 99362
$539,000D-
2 bd · 2.0 ba ·
1,392 sqft ·
Built 1925
· MultiFamily
· Active
· 251 DOM
Cashflow @ list (25.0% down · 7.5%)
Estimated rent
$4,374/mo
Mortgage (P&I)
−$2,827
Tax + insurance
−$500
HOA
−$0
Vac / Maint / Mgmt
−$919
Net cashflow
$129/mo
Annual
$1,552/yr
Cap rate
6.58%
Cash-on-cash
1.03%
DSCR
1.05
1% rule
0.81%
Cash to close
$150,920
Investor read
- This is a 1×2bd/1ba + 3×1bd/1ba units multifamily listed at $539k.
- At list price, monthly cash flow is $129 ($2k/yr) — positive. Per door: $32/mo.
- The deal already cash-flows at list — no discount required.
- To meet the 1% rule (rent ≥ 1% of price), the offer needs to be $437k (18.8% below list).
- It's been on market 251 days — a 12% lower offer ($474k) is reasonable based on typical stale-listing flexibility.
- Recommended offer: $437k (18.8% below list) — sets the bar for 1% rule.
- Local home prices are declining (-3.0%/yr); year-one equity from $4k of loan paydown is wiped out by about $16k of value loss. Plan a longer hold.
- Location reads 79/100 on livability (#105 in WA, #2,015 nationally) — a middle-class / working-renter tenant base. Strengths: amenities A+, commute A+, housing A+; Watch: schools C-.
- Walla Walla Public Schools (urban): math 41% / reading 50% proficiency, ranked #179 of 291 in WA (top 62%) — families likely to look elsewhere, expect single-tenant / working-renter base with shorter leases.
- Watch-outs: built in 1925 — expect roof / HVAC / electrical / plumbing capex.
- Market conditions: Rents rising (+2.4%/yr); 427 active listings in the ZIP; 7 comparable units currently listed for rent nearby; rentals at typical pace (median 22d on market — plan ~3-4 weeks tenant-placement turnaround); 43% of comp listings sitting > 30 days — soft ceiling on asking rent; 206 units permitted in Walla Walla County in 2024 (50 in 5+ unit buildings).
- Walla Walla County population projected at +8% by 2050 — modest demand growth; plan on rents tracking national, not racing it.
- 4 sale attempts since 9y ago; this cycle's ask has dropped $60k (10%) from the opening price — seller is motivated, your offer sets the floor, not the list.
- Current owner paid $205k; list at $539k implies a 163% gain — meaningful room to come down on a strong offer.
- Cap rate 6.6% vs local median 2.3% in Walla Walla — top-decile yield for the area; either an underpriced asset or a hidden risk that comps aren't pricing in. Stress-test before assuming the spread holds.
- At $4,374/mo this rent would consume 72% of the median local household income ($72k/yr) (locally 1238% of renters already pay >50% of income on rent) — very limited rent-growth headroom before tenants either downsize or default.
Questions for listing agent
- It's been on market 251 days. Have you received any prior offers? Is the seller open to a 19% concession, seller financing, or rate buy-down credit?
- Can we see the unit-by-unit rent roll, current vacancy, and any below-market leases? What's the average tenancy length?
- What capital expenditures (roof, boiler, parking lot, exteriors) have been made in the last 5 years, and what's planned in the next 2?
- Built in 1925 — when were the roof, HVAC, electrical panel, plumbing, and water heater last replaced?
- Why hasn't it sold? Are there any deal-killer items the seller is aware of (foundation, flood, title, zoning, code violations)?
- Is there a deadline driving the sale (1031 exchange, divorce, estate, relocation)? That informs how much negotiation room exists.
- The area grade is low — what's the realistic commute time and amenity access for the typical tenant pool here? Any planned neighborhood developments (good or bad) we should know about?
- What's the average days-on-market for RENTAL listings here right now (not sales)? A rising rental-DOM trend means longer vacancies and softer asking-rent achievability than the comps imply.
CashFlowRE · CFR-G4CXWACV3XEKGV
· Data 4 h ago
cashflowre.app · 2026-05-29