 Fourplex
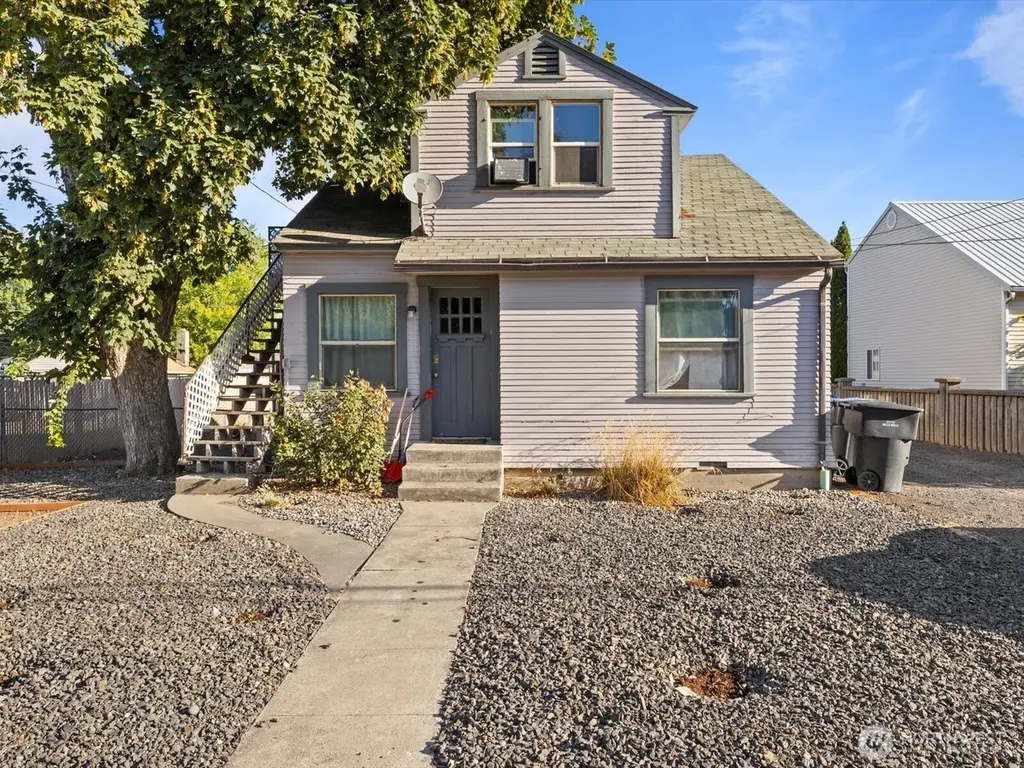
1813 Pleasant St · Walla Walla, WA
Flood risk 1/10 · Minimal
- FEMA flood zone
- —
- Chance of flooding over 30 yrs
- 0.0%
- Est. flood insurance / yr
- —
Fire risk 1/10 · Minimal
- Est. fire insurance / yr
- $604 – $1,122
Heat risk 4/10 · Minor
- Hot days now (above 97°F)
- 7 days/yr
- Hot days in 30 yrs
- 15 days/yr
Wind risk 1/10 · Minimal
- Chance of severe wind over 30 yrs
- —
Air-quality risk 8/10 · Major
- Unhealthy air days now
- 9 days/yr
- Unhealthy air days in 30 yrs
- 13 days/yr
Risk factors via First Street. Map © Google.
Why this score? — see what drove the D- grade
The composite is a weighted blend of 9 inputs, each scored 0–100. Each bar is that input's sub-score; the figure is the points it added to the 100-point composite (weight × sub-score).
- Cash flow +14.6/30.0
- DSCR +4.5/10.0
- Schools +4.1/10.0
- Livability +4.0/5.0
- 1% rule +3.1/10.0
- Rent growth +3.1/5.0
- Condition / age +2.5/5.0
- ARV discount +0.0/15.0
- Appreciation +0.0/10.0
$539,000
🖨 Deal sheet (PDF) 📄 Offer letter ✓ Due diligence
Multi-family units
County records classify this as Multi-Family (2-4 Unit). Listing-text estimate: 4 units. confirmed
Listing remarks
Profitable renovated 4-plex in Walla Walla! The property features four units. The main level unit includes 2 bed 1 bath while the basement and upper units feature 1 bed 1 bath. The additional detached cottage offers 1 bedroom and 1 bathroom. The entire interior has been updated from the studs with new vinyl and laminate flooring, fresh paint, cabinets, electrical, counters, and beautiful modern bathrooms. Two units come equipped with their own washer and dryer. Ample parking to accommodate all residents. The location provides easy access to nearby schools, parks, shopping, and entertainment.
Key facts
- Fresh paint
- New cabinets
- Updated interior
Tags
Neighborhood map
What this means for you Summary
Snapshot
- This is a 1×2bd/1ba + 3×1bd/1ba units multifamily listed at $539k.
Deal economics
- At list price, monthly cash flow is $129 ($2k/yr) — positive. Per door: $32/mo.
- The deal already cash-flows at list — no discount required.
- To meet the 1% rule (rent ≥ 1% of price), the offer needs to be $437k (18.8% below list).
- Recommended offer: $437k (18.8% below list) — sets the bar for 1% rule.
- Cap rate 6.6% vs local median 2.3% in Walla Walla — top-decile yield for the area; either an underpriced asset or a hidden risk that comps aren't pricing in. Stress-test before assuming the spread holds.
Location & tenants
- Location reads 79/100 on livability (#105 in WA, #2,015 nationally) — a middle-class / working-renter tenant base. Strengths: amenities A+, commute A+, housing A+; Watch: schools C-.
- Walla Walla Public Schools (urban): math 41% / reading 50% proficiency, ranked #179 of 291 in WA (top 62%) — families likely to look elsewhere, expect single-tenant / working-renter base with shorter leases.
- Market conditions: Rents rising (+2.4%/yr); 422 active listings in the ZIP; 7 comparable units currently listed for rent nearby; rentals at typical pace (median 22d on market — plan ~3-4 weeks tenant-placement turnaround); 43% of comp listings sitting > 30 days — soft ceiling on asking rent; 206 units permitted in Walla Walla County in 2024 (50 in 5+ unit buildings).
- At $4,374/mo this rent would consume 72% of the median local household income ($72k/yr) (locally 1238% of renters already pay >50% of income on rent) — very limited rent-growth headroom before tenants either downsize or default.
Forward outlook
- Local home prices are declining (-3.0%/yr); year-one equity from $4k of loan paydown is wiped out by about $16k of value loss. Plan a longer hold.
- Walla Walla County population projected at +8% by 2050 — modest demand growth; plan on rents tracking national, not racing it.
Negotiation context
- It's been on market 249 days — a 12% lower offer ($474k) is reasonable based on typical stale-listing flexibility.
- 4 sale attempts since 9y ago; this cycle's ask has dropped $60k (10%) from the opening price — seller is motivated, your offer sets the floor, not the list.
- Current owner paid $205k; list at $539k implies a 163% gain — meaningful room to come down on a strong offer.
Risks & watch-outs
- Watch-outs: built in 1925 — expect roof / HVAC / electrical / plumbing capex.
Questions for the listing agent
- It's been on market 249 days. Have you received any prior offers? Is the seller open to a 19% concession, seller financing, or rate buy-down credit?
- Can we see the unit-by-unit rent roll, current vacancy, and any below-market leases? What's the average tenancy length?
- What capital expenditures (roof, boiler, parking lot, exteriors) have been made in the last 5 years, and what's planned in the next 2?
- Built in 1925 — when were the roof, HVAC, electrical panel, plumbing, and water heater last replaced?
- Why hasn't it sold? Are there any deal-killer items the seller is aware of (foundation, flood, title, zoning, code violations)?
- Is there a deadline driving the sale (1031 exchange, divorce, estate, relocation)? That informs how much negotiation room exists.
- The area grade is low — what's the realistic commute time and amenity access for the typical tenant pool here? Any planned neighborhood developments (good or bad) we should know about?
- What's the average days-on-market for RENTAL listings here right now (not sales)? A rising rental-DOM trend means longer vacancies and softer asking-rent achievability than the comps imply.
- What's the recent tenant-quality profile in this submarket — average credit score on applications, eviction rate, late-payment / NSF rate, and stable-employment percentage? A property-management company in the area should have these aggregated.
- How much new apartment / multifamily construction is in the pipeline within 1–3 miles? Heavy new supply (>2% of stock underway) typically softens rents 12–24 months out; light construction supports rent growth.
Investment metrics
- 1% rule
- 0.81% ✗
- Cap rate
- 6.58%
- Cash-on-cash
- 1.03%
- DSCR
- 1.05
- GRM
- 10.3
CMA / ARV
- ARV (median comp)
- $386,060
- List price
- $539,000
- Delta
- 39.62%
- Verdict
- OVERPRICED
- Comps
- 8 within 1.0 mi
Projected returns pro-forma
-3.0% appreciation · 2.4% rent growth · sell at horizon
- IRR
- -15.3%
- Equity multiple
- 0.46×
- Total profit
- $-81,908
- Equity at exit
- $80,367
- IRR
- -7.8%
- Equity multiple
- 0.52×
- Total profit
- $-72,086
- Equity at exit
- $46,603
Cash invested: $150,920 (down + closing). Projections, not guarantees.
Landlord ↔ Tenant lean methodology
- Overall (STATE)
- 28 Tenant-Leaning
- State Washington
- 28 Tenant-Leaning · D+8
- County
- — inherits STATE
- City
- — inherits STATE
ZIP-level market 99362
- Rents YoY
- 2.4%
- Active inventory
- 422
- Price-to-rent
- 36.9×
Monthly cashflow live
- Estimated rent
- $4,374 medium interval (Pro) →
- Mortgage (P&I)
- −$2,827
- Tax from tax record
- −$275 /mo · $3,300/yr
- Insurance
- −$225
- HOA
- −$0
- Vacancy / Maint / Mgmt
- −$919
- Net cashflow
- $129
Break-even live
Sensitivity live
| Price | -10% $434 | -5% $282 | +0% $129 | +5% $-23 | +10% $-176 |
|---|---|---|---|---|---|
| Rent | -10% $-216 | -5% $-43 | +0% $129 | +5% $302 | +10% $475 |
| Rate | -1.0pp $401 | -0.5pp $266 | base $129 | +0.5pp $-10 | +1.0pp $-152 |
4-unit breakdown (identical units grouped — click to expand)
| Units | Beds | Baths | Est. rent |
|---|---|---|---|
| 1× unit | 2 | 1 | $1,216 |
| 3× units | 1 | 1 | $3,159 |
| #2 | 1 | 1 | $1,053 |
| #3 | 1 | 1 | $1,053 |
| #4 | 1 | 1 | $1,053 |
| Total (4 units) | $4,374 | ||
UW: 25.0% down · 7.5% · 30yr · 1.5% tax · 5.0% vac · 8.0% maint · 8.0% mgmt
Financing live
Cash to close
- Down payment
- $134,750
- Closing costs
- $16,170
- Reserves months
- —
- Total cash needed
- —
Loan-product check · same deal, 3 products live
Conventional
25% down · 7.5% · 30yr
- Down + closing
- —
- Monthly P&I
- —
- Monthly cashflow
- —
- DSCR
- —
- Eligible?
- —
Personal DTI + credit; lowest rate.
DSCR
20% down · 8.5% · 30yr
- Down + closing
- —
- Monthly P&I
- —
- Monthly cashflow
- —
- DSCR
- —
- Eligible?
- —
No personal income docs; deal must DSCR.
Hard money
10% down · 12.0% · 12mo
- Down + closing
- —
- Monthly P&I
- —
- Monthly cashflow
- —
- DSCR
- —
- Eligible?
- —
Short-term bridge; refi at stabilization.
Rent comps 7 comps
| Address | Beds | Baths | Sqft | Rent | $/sqft | DOM | Units | Dist |
|---|---|---|---|---|---|---|---|---|
| 1800 Evergreen St Walla Walla, WA | 2.0 | 1.0 | 797 | $1,000 | $1.25 | 22d | 3 | 0.85mi |
| 2222 Isaacs Ave Walla Walla, WA | 2.0 | 1.0 | 1011 | $1,672 | $1.65 | 14d | 6 | 0.90mi |
| 2210 E Isaacs Ave Walla Walla, WA | 1.0–3.0 | 1.0–2.0 | 1033 | $1,765 | $1.71 | 14d | 1 | 0.92mi |
| 15 S Clinton St Walla Walla, WA | 2.0 | 1.0 | 1835 | $2,230 | $1.22 | 44d | 1 | 1.26mi |
| 608 N Roosevelt St Unit 608NROO Walla Walla, WA | 2.0 | 2.0 | 894 | $1,425 | $1.59 | 44d | 1 | 1.27mi |
| 625 Wellington Ave Walla Walla, WA | 1.0–2.0 | 1.0 | 854 | $1,695 | $1.98 | 22d | 11 | 1.27mi |
| 115 Merriam St Walla Walla, WA | 1.0–2.0 | 1.0 | 800 | $1,650 | $2.06 | 44d | 9 | 1.38mi |
Listing history 26 events
-
2026-06-19days on market $539,000 Active 249 DOM
-
2026-06-18days on market $539,000 Active 248 DOM
-
2026-06-17days on market $539,000 Active 247 DOM
-
2026-06-16days on market $539,000 Active 246 DOM
-
2026-06-15days on market $539,000 Active 245 DOM
-
2026-06-14days on market $539,000 Active 243 DOM
-
2026-06-12days on market $539,000 Active 242 DOM
-
2026-06-09days on market $539,000 Active 239 DOM
-
2026-06-08days on market $539,000 Active 238 DOM
-
2026-06-07days on market $539,000 Active 237 DOM
-
2026-06-02days on market $539,000 Active 232 DOM
-
2026-06-01days on market $539,000 Active 231 DOM
-
2026-05-31days on market $539,000 Active 230 DOM
-
2026-05-30days on market $539,000 Active 229 DOM
-
2026-05-12price $539,000
-
2026-03-10price $569,000
-
2025-10-13$599,000 Active
-
2024-04-10historical $1,650
-
2024-04-01$1,650
-
2023-11-08historical $1,100
-
2023-10-27$1,100
-
2018-02-28soldstatus $204,757
-
2018-02-28soldstatus $204,757
-
2017-12-13$219,000
-
2003-03-14soldstatus $130,000
-
1994-05-19soldstatus $78,500
ⓘ Source: listings_history table (triggers on properties + properties_extension) + one-shot
backfill from property_details.listing_events for pre-trigger history.
Tax reassessment forecast WA · Resets to sale price
- Current annual tax
- $3,300 · $275/mo
- Projected year-2 tax
- $5,282 · $440/mo
- Expected delta
- +$1,983/yr (+$165/mo · 60.1%)
ⓘ Screening estimate from a state-policy table — verify with the county assessor before closing.
Climate risk First Street
- Flood 1/10 Low 0% chance over 30 yrs
- Wildfire 1/10 Low
- Heat 4/10 Moderate 7 d/yr ≥97°F today · 15 d/yr by 30 yrs out
- Wind 1/10 Low
- Air quality 8/10 Severe 9 unhealthy d/yr today · 13 by 30 yrs out
Nearby sold comps map
Loading sold comps map…
Walkable amenities ~0.75 mi
Loading nearby amenities…
Taxation est. · year 1
- Rental income
- $52,488
- − Mortgage interest
- −$30,192
- − Property taxes
- −$3,300
- − Insurance
- −$2,695
- − Repairs & maintenance
- −$4,199
- − Management
- −$4,199
- − Depreciation
- −$15,680
- Taxable loss
- −$7,777
- Est. tax savings @ 24.0%
- +$1,866
- After-tax cash flow
- $3,419/yr
For passive investors: Depreciation is non-cash, so a rental often shows a tax loss while cash-flowing — sheltering income. Rental losses are passive: they offset passive income freely, and up to $25,000/yr can offset ordinary (W-2) income if you actively participate and your MAGI is under $100k (phasing out to $0 by $150k); unused losses carry forward. On sale, claimed depreciation is recaptured at up to 25%, and gains may owe capital-gains tax (a 1031 exchange can defer both). Figures are a year-1 estimate at your 24.0% rate — not tax advice; consult a CPA.
Schools (NCES district)
- District
- Walla Walla Public Schools
- NCES district ID
- 5309450
- Math proficiency
- 41% ▲ 3.00%
- Reading proficiency
- 50% ▼ -1.00%
- Median HH income
- $46,207
- Composite
- 40.88/100
- National rank
- #7531
- State rank
- #179 of 291 in WA
Livability — Walla Walla
- Score
- 79/100
- State rank
- #105
- US rank
- #2015
Category grades
Schools grade is shown separately in the Schools card above.
Census & demographics
- Census place
- Walla Walla, WA
- County
- Walla Walla County · 52,990 people
- City population
- 42,853
- Metro
- Walla Walla, WA
- Population (ZIP)
- 42,853
- Household income
- $72,474
- Rent vs Own
- Severe rent burden
- 1238.0
Population outlook (Walla Walla County) Hauer SSP2
- Today (2025)
- 63,088 people
- By 2030
- 64,417 · +2.1%
- By 2040
- 66,563 · +5.5%
- By 2050
- 68,337 · +8.3%
- By 2075
- 73,235 · +16.1%
- By 2100
- 74,878 · +18.7%
Race, ethnicity, and origin ACS 2023
- Neighborhood character
- Predominantly White (69%)
- Race & ethnicity
- White 69% Hispanic / Latino 22% Two or more races 9% Black 2% Asian 2% Native American 2%
- Hispanic origin (detail)
- Mexican 17%
- Common ancestry
- Slovak 3% Portuguese 3% Lithuanian 3%
- Foreign-born
- 9% · Canada, China
- Languages at home
- 83% English-only · Spanish 15% Chinese 1%
Political lean MEDSL · Walla Walla
- 2024 margin
- Lean R (+8.1) · D 44.6% · R 52.7% · Other 2.7%
- 2008→2024 swing
- +8.5pp toward D · 2008: -16.6pp · 2024: -8.1pp
- All cycles
- 2024: R+8.1 2020: R+8.7 2016: R+16.4 2012: R+22.3 2008: R+16.6
Not yet ingested
- Civics
- —
Market trends
- HPI YoY
- ▼ -488.03%
- Current HPI
- 321.6891
- Rent YoY
- ▲ 2.40%
- Metro
- Walla Walla, WA
- State GDP YoY
- ▲ 4.65%
- F500 in state
- 22
Industry mix (Fortune 500 HQ in WA)
| Industry | F500 HQs | Revenue |
|---|---|---|
| Retail | 2 | $269B |
|
||
| Technology / Retail | 1 | $638B |
|
||
| Technology | 1 | $245B |
|
||
| Telecommunications | 1 | $38B |
|
||
| Food / Beverage | 1 | $36B |
|
||
| Automotive / Trucks | 1 | $34B |
|
||
Price history
+586.6% since first listed12 events — show timeline
- 2026-05-12 Price Changed $539,000 NWMLS as Distributed by MLS Grid
- 2026-03-10 Price Changed $569,000 NWMLS as Distributed by MLS Grid
- 2025-10-13 Listed $599,000 NWMLS as Distributed by MLS Grid
- 2024-04-10 Rental Removed $1,650 APPFOLIO
- 2024-04-01 Listed for Rent $1,650 APPFOLIO
- 2023-11-08 Rental Removed $1,100 APPFOLIO
- 2023-10-27 Listed for Rent $1,100 APPFOLIO
- 2018-02-28 Sold (Public Records) $204,757 Public Records
- 2018-02-28 Sold (MLS) $204,757 NWMLS as Distributed by MLS Grid
- 2017-12-13 Listed $219,000 NWMLS as Distributed by MLS Grid
- 2003-03-14 Sold (Public Records) $130,000 Public Records
- 1994-05-19 Sold (Public Records) $78,500 Public Records
Property tax history
+4.8%/yrLatest (2026): $3,300 · -1.3% YoY. Source: county tax records.
Cash-flow waterfall
monthlySold comps — $/sqft
last 12 mo · ≤1 miLoading sold comps…