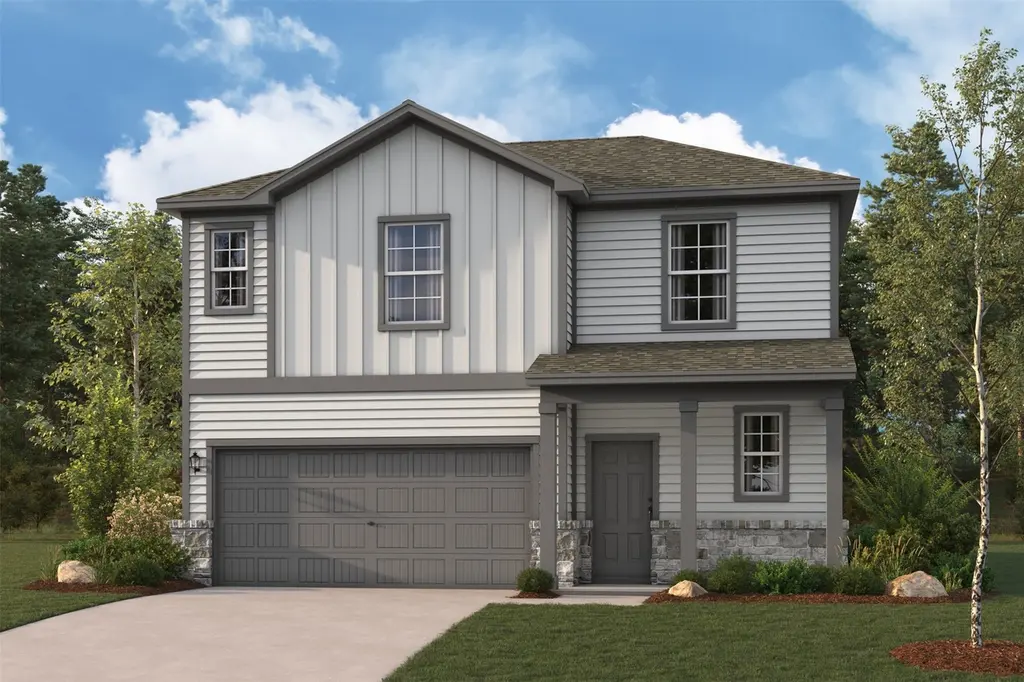
17801 Lionheart Rd
Deerwood, TX 77306
$268,900D-
4 bd · 2.5 ba ·
1,882 sqft ·
Built 2026
· Land
· Active
· 39 DOM
Cashflow @ list (25.0% down · 7.5%)
Estimated rent
$2,013/mo
Mortgage (P&I)
−$1,278
Tax + insurance
−$406
HOA
−$50
Vac / Maint / Mgmt
−$423
Net cashflow
$-144/mo
Annual
$-1,730/yr
Cap rate
5.58%
Cash-on-cash
-2.54%
DSCR
0.89
1% rule
0.83%
Cash to close
$68,240
Investor read
- This is a 4-bed/2.5-bath land listed at $269k.
- At list price, monthly cash flow is $-144 ($-2k/yr) — negative.
- To cash-flow at today's rent, offer at most $223k (17.1% below list).
- To meet the 1% rule (rent ≥ 1% of price), the offer needs to be $201k (25.1% below list).
- It's been on market 39 days — a 3% lower offer ($261k) is reasonable based on typical stale-listing flexibility.
- Recommended offer: $201k (25.1% below list) — sets the bar for 1% rule.
- Local home prices are declining (-3.0%/yr); year-one equity from $2k of loan paydown is wiped out by about $7k of value loss. Plan a longer hold.
- Location reads: area grade D — affects rentability + tenant quality, not the cash-flow math above.
- Conroe ISD (other): math 57% / reading 57% proficiency, ranked #69 of 826 in TX (top 8%) — acceptable for families but not a draw, mixed tenant base, ~2y average lease.
- Zoned schools: Caney Creek H S (math 33% / reading 42%, grade F, #888 of 1,632 statewide, top 55%, 2,504 students, 79% FRL) — zoned schools average 79% FRL vs 34% district-wide (45 pts higher); higher-poverty schools than district average — tighter screening recommended.
- Zoned-school proficiency averages 38% at this address vs 57% district-wide (-20 pts) — the specific schools serving this property underperform the Conroe ISD average; the district grade overstates school quality for this exact location.
- Market conditions: 416 active listings in the ZIP; 4 comparable units currently listed for rent nearby; rentals lingering (median 45d on market — plan ~5-8 weeks vacancy on turnover, expect pricing pressure); 50% of comp listings sitting > 30 days — soft ceiling on asking rent; solid renter incomes; 13,259 units permitted in Montgomery County in 2024 (1,402 in 5+ unit buildings).
- Montgomery County population projected at +65% by 2050 — long-run rental-demand tailwind backs the buy-and-hold thesis.
- 2 sale attempts with the ask held roughly flat each time — persistent listings suggest the price (not the market) is what's stuck; bring a comps-based counter.
- This rent runs 32% of the median local income ($76k/yr) — at the standard rent-burdened threshold; future hikes will face affordability resistance.
Questions for listing agent
- What do current leases actually rent for vs. the listed asking? Can we see a recent rent roll and the last 12 months of T-12 income?
- It's been on market 39 days. Have you received any prior offers? Is the seller open to a 25% concession, seller financing, or rate buy-down credit?
- What does the HOA fee cover, when was the last increase, and are there any pending special assessments or reserve-fund shortfalls?
- Is there a deadline driving the sale (1031 exchange, divorce, estate, relocation)? That informs how much negotiation room exists.
- The area grade is low — what's the realistic commute time and amenity access for the typical tenant pool here? Any planned neighborhood developments (good or bad) we should know about?
- What's the average days-on-market for RENTAL listings here right now (not sales)? A rising rental-DOM trend means longer vacancies and softer asking-rent achievability than the comps imply.
- What's the recent tenant-quality profile in this submarket — average credit score on applications, eviction rate, late-payment / NSF rate, and stable-employment percentage? A property-management company in the area should have these aggregated.
- How much new for-sale + rental construction is in the pipeline within 1–3 miles? Heavy new supply typically softens prices + rents 12–24 months out; constrained supply supports both.
CashFlowRE · CFR-G8Y1BSAJP5M0Z8
· Data 8 h ago
cashflowre.app · 2026-05-29