 🏗️ New Construction
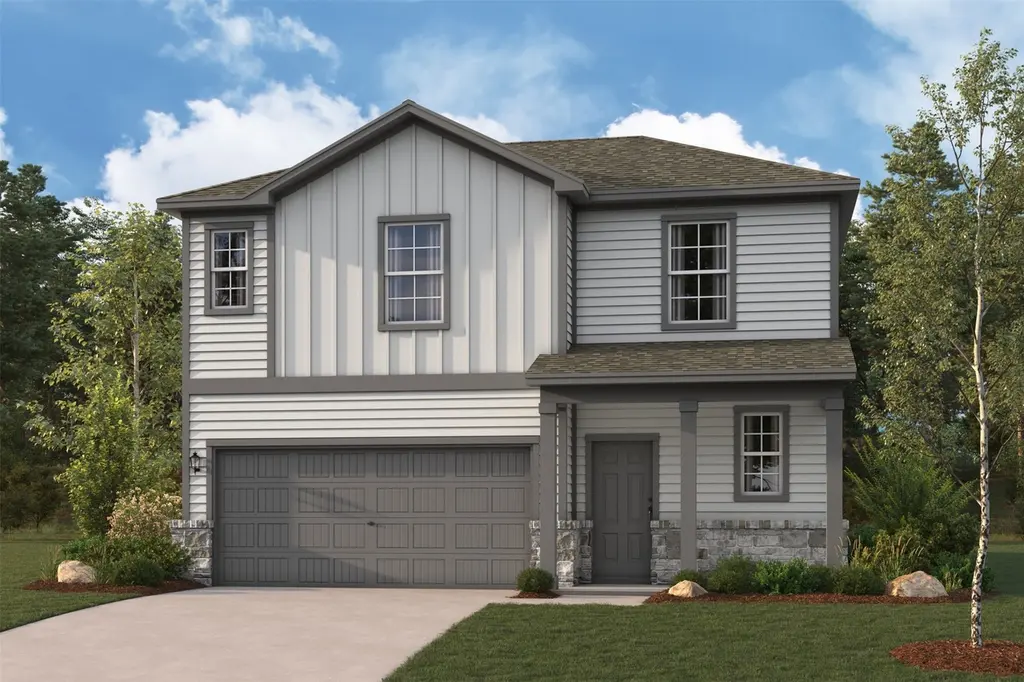
17801 Lionheart Rd · Deerwood, TX
Flood risk No data
- FEMA flood zone
- —
- Chance of flooding over 30 yrs
- —
- Est. flood insurance / yr
- —
Fire risk No data
- Est. fire insurance / yr
- —
Heat risk No data
- Hot days now (above threshold)
- —
- Hot days in 30 yrs
- —
Wind risk No data
- Chance of severe wind over 30 yrs
- —
Air-quality risk No data
- Unhealthy air days now
- —
- Unhealthy air days in 30 yrs
- —
Risk factors via First Street. Map © Google.
Why this score? — see what drove the D- grade
The composite is a weighted blend of 9 inputs, each scored 0–100. Each bar is that input's sub-score; the figure is the points it added to the 100-point composite (weight × sub-score).
- Cash flow +10.1/30.0
- ARV discount +7.5/15.0
- Schools +5.1/10.0
- 1% rule +3.3/10.0
- DSCR +2.9/10.0
- Rent growth +2.5/5.0
- Livability +2.5/5.0
- Condition / age +2.5/5.0
- Appreciation +0.0/10.0
$268,900
🖨 Deal sheet (PDF) 📄 Offer letter ✓ Due diligence
Listing remarks MLS
Meet the Gannet! This two-story plan boasts an open-concept layout on the main floor, with an airy great room overlooking a dining area and a kitchen. Rounding out the main floor is the spacious primary suite, featuring a walk-in closet and a luxurious private bath with a walk-in shower. The upper floor features two additional roomy bedrooms and a shared bath, with the option of another bedroom or inviting loft. The Gannet is filled with natural light, elegant finishes, and thoughtful details throughout.
Key facts
- Walk-in closet
- Private bath
- Covered patio
Tags
Property features AI
Finance
- HOA & community: Sherwood Glen POA with an annual fee of $600; Curbs in community
Exterior
- Parking: Attached garage; 2 garage spaces
- Security: Prewired for security; Smoke detectors
- Utilities: Public water; Public sewer
- Home design: Residential property; Under construction (new construction); Slab foundation
- Construction: Built by Century Communities; 2026 construction; Brick and cement siding exterior; Composition roof
- Exterior features: Deck; Patio; Private yard; Subdivision setting; Concrete road frontage
Interior
- Kitchen: Dishwasher; Electric oven; Electric range; Microwave; Disposal
- Bedrooms: Primary bedroom on first floor (13'‑8" x 12'‑2"); Three additional bedrooms on second floor (approx. 12'‑9.5" x 10', 10'‑0.5" x 11', 10'‑3" x 10'‑7")
- Bathrooms: Two full bathrooms; One half bathroom
- Heating & cooling: Central electric heating; Central air conditioning
- Interior features: Breakfast bar; Granite counters; High ceilings; Kitchen/family room combo; Primary bedroom with private bath; Pantry; Separate shower and tub/shower; Ceiling fans; Programmable thermostat; Low emissivity windows
- Laundry & utility: Washer hookup; Electric dryer hookup
Neighborhood map
What this means for you Summary
Snapshot
- This is a 4-bed/2.5-bath land listed at $269k.
Deal economics
- At list price, monthly cash flow is $-144 ($-2k/yr) — negative.
- To cash-flow at today's rent, offer at most $223k (17.1% below list).
- To meet the 1% rule (rent ≥ 1% of price), the offer needs to be $201k (25.1% below list).
- Recommended offer: $201k (25.1% below list) — sets the bar for 1% rule.
Location & tenants
- Location reads: area grade D — affects rentability + tenant quality, not the cash-flow math above.
- Conroe ISD (other): math 57% / reading 57% proficiency, ranked #69 of 826 in TX (top 8%) — acceptable for families but not a draw, mixed tenant base, ~2y average lease.
- Zoned schools: Caney Creek H S (math 33% / reading 42%, grade F, #888 of 1,632 statewide, top 55%, 2,504 students, 79% FRL) — zoned schools average 79% FRL vs 34% district-wide (45 pts higher); higher-poverty schools than district average — tighter screening recommended.
- Zoned-school proficiency averages 38% at this address vs 57% district-wide (-20 pts) — the specific schools serving this property underperform the Conroe ISD average; the district grade overstates school quality for this exact location.
- Market conditions: 416 active listings in the ZIP; 4 comparable units currently listed for rent nearby; rentals lingering (median 45d on market — plan ~5-8 weeks vacancy on turnover, expect pricing pressure); 50% of comp listings sitting > 30 days — soft ceiling on asking rent; solid renter incomes; 13,259 units permitted in Montgomery County in 2024 (1,402 in 5+ unit buildings).
- This rent runs 32% of the median local income ($76k/yr) — at the standard rent-burdened threshold; future hikes will face affordability resistance.
Forward outlook
- Local home prices are declining (-3.0%/yr); year-one equity from $2k of loan paydown is wiped out by about $7k of value loss. Plan a longer hold.
- Montgomery County population projected at +65% by 2050 — long-run rental-demand tailwind backs the buy-and-hold thesis.
Negotiation context
- It's been on market 39 days — a 3% lower offer ($261k) is reasonable based on typical stale-listing flexibility.
- 2 sale attempts with the ask held roughly flat each time — persistent listings suggest the price (not the market) is what's stuck; bring a comps-based counter.
Questions for the listing agent
- What do current leases actually rent for vs. the listed asking? Can we see a recent rent roll and the last 12 months of T-12 income?
- It's been on market 39 days. Have you received any prior offers? Is the seller open to a 25% concession, seller financing, or rate buy-down credit?
- What does the HOA fee cover, when was the last increase, and are there any pending special assessments or reserve-fund shortfalls?
- Is there a deadline driving the sale (1031 exchange, divorce, estate, relocation)? That informs how much negotiation room exists.
- The area grade is low — what's the realistic commute time and amenity access for the typical tenant pool here? Any planned neighborhood developments (good or bad) we should know about?
- What's the average days-on-market for RENTAL listings here right now (not sales)? A rising rental-DOM trend means longer vacancies and softer asking-rent achievability than the comps imply.
- What's the recent tenant-quality profile in this submarket — average credit score on applications, eviction rate, late-payment / NSF rate, and stable-employment percentage? A property-management company in the area should have these aggregated.
- How much new for-sale + rental construction is in the pipeline within 1–3 miles? Heavy new supply typically softens prices + rents 12–24 months out; constrained supply supports both.
Investment metrics
- 1% rule
- 0.83% ✗
- Cap rate
- 5.58%
- Cash-on-cash
- -2.54%
- DSCR
- 0.89
- GRM
- 10.1
CMA / ARV
- ARV (median comp)
- $243,715
- List price
- $268,900
- Delta
- 10.33%
- Verdict
- OVERPRICED
- Comps
- 20 within 1.0 mi
Projected returns pro-forma
-3.0% appreciation · 3.0% rent growth · sell at horizon
- IRR
- -20.5%
- Equity multiple
- 0.29×
- Total profit
- $-48,614
- Equity at exit
- $36,339
- IRR
- -13.6%
- Equity multiple
- 0.21×
- Total profit
- $-53,909
- Equity at exit
- $21,072
Cash invested: $68,240 (down + closing). Projections, not guarantees.
Landlord ↔ Tenant lean methodology
- Overall (STATE)
- 87 Strongly Landlord-Friendly
- State Texas
- 87 Strongly Landlord-Friendly · R+5
- County
- — inherits STATE
- City
- — inherits STATE
ZIP-level market 77306
- Home prices YoY
- -4.1%
- Active inventory
- 416
- Price-to-rent
- 11.1×
Monthly cashflow live
- Estimated rent
- $2,013 medium interval (Pro) →
- Mortgage (P&I)
- −$1,278
- Tax est. 1.5%
- −$305 /mo · $3,656/yr
- Insurance
- −$102
- HOA
- −$50
- Vacancy / Maint / Mgmt
- −$423
- Net cashflow
- $-144
Break-even live
Sensitivity live
| Price | -10% $24 | -5% $-60 | +0% $-144 | +5% $-228 | +10% $-313 |
|---|---|---|---|---|---|
| Rent | -10% $-303 | -5% $-224 | +0% $-144 | +5% $-65 | +10% $15 |
| Rate | -1.0pp $-21 | -0.5pp $-82 | base $-144 | +0.5pp $-207 | +1.0pp $-272 |
UW: 25.0% down · 7.5% · 30yr · 1.5% tax · 5.0% vac · 8.0% maint · 8.0% mgmt
Financing live
Cash to close
- Down payment
- $60,929
- Closing costs
- $7,311
- Reserves months
- —
- Total cash needed
- —
Loan-product check · same deal, 3 products live
Conventional
25% down · 7.5% · 30yr
- Down + closing
- —
- Monthly P&I
- —
- Monthly cashflow
- —
- DSCR
- —
- Eligible?
- —
Personal DTI + credit; lowest rate.
DSCR
20% down · 8.5% · 30yr
- Down + closing
- —
- Monthly P&I
- —
- Monthly cashflow
- —
- DSCR
- —
- Eligible?
- —
No personal income docs; deal must DSCR.
Hard money
10% down · 12.0% · 12mo
- Down + closing
- —
- Monthly P&I
- —
- Monthly cashflow
- —
- DSCR
- —
- Eligible?
- —
Short-term bridge; refi at stabilization.
Rent comps 4 comps
| Address | Beds | Baths | Sqft | Rent | $/sqft | DOM | Units | Dist |
|---|---|---|---|---|---|---|---|---|
| 2221 Cedar Valley Dr Conroe, TX | 3.0 | 2.0 | 1920 | $1,695 | $0.88 | 44d | 1 | 0.37mi |
| 2140 Cedar Bend Dr Conroe, TX | 4.0 | 3.0 | 1871 | $1,995 | $1.07 | 11d | 1 | 0.39mi |
| 308 Kinsman Rd Cleveland, TX | 3.0 | 1.5 | 1400 | $1,650 | $1.18 | 8d | 1 | 1.20mi |
| 308 Kinsman Rd Cleveland, TX | 3.0 | 1.5 | 1400 | $1,650 | $1.18 | 44d | 1 | 1.20mi |
HOA detail
- Monthly dues
- $50 · $600/yr
Listing history 17 events
-
2026-06-21days on market $268,900 Active 39 DOM
-
2026-06-18days on market $268,900 Active 36 DOM
-
2026-06-17days on market $268,900 Active 35 DOM
-
2026-06-16days on market $268,900 Active 34 DOM
-
2026-06-16remarks 699-char remark
-
2026-06-15days on market $268,900 Active 33 DOM
-
2026-06-13days on market $268,900 Active 31 DOM
-
2026-06-09days on market $268,900 Active 27 DOM
-
2026-06-08days on market $268,900 Active 26 DOM
-
2026-06-07days on market $268,900 Active 25 DOM
-
2026-06-04days on market $268,900 Active 22 DOM
-
2026-06-03days on market $268,900 Active 21 DOM
-
2026-06-02days on market $268,900 Active 20 DOM
-
2026-06-01days on market $268,900 Active 19 DOM
-
2026-05-31days on market $268,900 Active 18 DOM
-
2026-05-13$268,900 Active 891-char remark
-
2026-04-29$268,900 Active 564-char remark
Show marketing remark (509 chars)
Meet the Gannet! This two-story plan boasts an open-concept layout on the main floor, with an airy great room overlooking a dining area and a kitchen. Rounding out the main floor is the spacious primary suite, featuring a walk-in closet and a luxurious private bath with a walk-in shower. The upper floor features two additional roomy bedrooms and a shared bath, with the option of another bedroom or inviting loft. The Gannet is filled with natural light, elegant finishes, and thoughtful details throughout.
ⓘ Source: listings_history table (triggers on properties + properties_extension) + one-shot
backfill from property_details.listing_events for pre-trigger history.
Nearby sold comps map
Loading sold comps map…
Walkable amenities ~0.75 mi
Loading nearby amenities…
Taxation est. · year 1
- Rental income
- $24,153
- − Mortgage interest
- −$13,652
- − Property taxes
- −$3,656
- − Insurance
- −$1,219
- − Repairs & maintenance
- −$1,932
- − Management
- −$1,932
- − HOA
- −$600
- − Depreciation
- −$7,090
- Taxable loss
- −$5,927
- Est. tax savings @ 24.0%
- +$1,423
- After-tax cash flow
- $-308/yr
For passive investors: Depreciation is non-cash, so a rental often shows a tax loss while cash-flowing — sheltering income. Rental losses are passive: they offset passive income freely, and up to $25,000/yr can offset ordinary (W-2) income if you actively participate and your MAGI is under $100k (phasing out to $0 by $150k); unused losses carry forward. On sale, claimed depreciation is recaptured at up to 25%, and gains may owe capital-gains tax (a 1031 exchange can defer both). Figures are a year-1 estimate at your 24.0% rate — not tax advice; consult a CPA.
Schools (NCES district)
- District
- Conroe ISD
- NCES district ID
- 4815000
- Math proficiency
- 57% ▼ -6.00%
- Reading proficiency
- 57% ▼ -1.00%
- Median HH income
- $71,541
- Composite
- 50.65/100
- National rank
- #1833
- State rank
- #69 of 826 in TX
Livability — Deerwood
No livability data for this city. (Only ~50 U.S. cities are tracked.)
Census & demographics
- County
- Montgomery County · 663,713 people
- Metro
- Houston-The Woodlands-Sugar Land, TX
- Population (ZIP)
- 18,086
- Household income
- $76,257
- Rent vs Own
- Severe rent burden
- 231.0
Population outlook (Montgomery County) Hauer SSP2
- Today (2025)
- 713,896 people
- By 2030
- 805,263 · +12.8%
- By 2040
- 992,708 · +39.1%
- By 2050
- 1,179,590 · +65.2%
- By 2075
- 1,628,084 · +128.1%
- By 2100
- 1,937,880 · +171.5%
Race, ethnicity, and origin ACS 2023
- Neighborhood character
- Majority Hispanic (55%)
- Race & ethnicity
- Hispanic / Latino 55% White 41% Two or more races 11% Black 2%
- Hispanic origin (detail)
- Mexican 51%
- Common ancestry
- Iranian 1% Slovak 1% Lithuanian 1%
- Foreign-born
- 21% · Canada
- Languages at home
- 53% English-only · Spanish 45% German/W. Germanic 1%
Political lean MEDSL · Montgomery
- 2024 margin
- Solid R (+45.5) · D 26.8% · R 72.3%
- 2008→2024 swing
- +7.2pp toward D · 2008: -52.7pp · 2024: -45.5pp
- All cycles
- 2024: R+45.5 2020: R+43.8 2016: R+51.4 2012: R+60.7 2008: R+52.7
Not yet ingested
- Civics
- —
Market trends
- HPI YoY
- ▼ -13.02%
- Current HPI
- 306.3801
- Rent YoY
- —
- Metro
- Houston-The Woodlands-Sugar Land, TX
- State GDP YoY
- ▲ 3.95%
- F500 in state
- 110
Industry mix (Fortune 500 HQ in TX)
| Industry | F500 HQs | Revenue |
|---|---|---|
| Energy | 16 | $1,198B |
|
||
| Technology | 5 | $198B |
|
||
| Engineering / Construction | 4 | $72B |
|
||
| Energy Services | 3 | $60B |
|
||
| Utilities | 3 | $41B |
|
||
| Healthcare | 2 | $330B |
|
||
Price history
+0.0% since first listed2 events — show timeline
- 2026-05-13 Listed $268,900 HARMLS
- 2026-04-29 Listed $268,900 Zillow
Property tax history
-30.3%/yrLatest (2025): $470 · -30.3% YoY. Source: county tax records.
Cash-flow waterfall
monthlySold comps — $/sqft
last 12 mo · ≤1 miLoading sold comps…