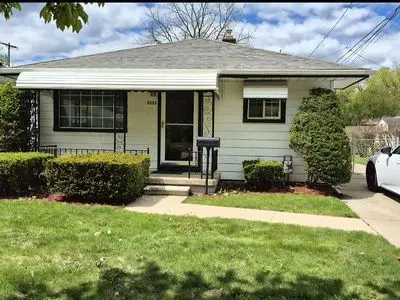
5332 Weddell St
Dearborn Heights, MI 48125
$143,000C+
3 bd · 1.0 ba ·
936 sqft ·
Built 1958
· SingleFamily
· Under Contract
· 1 DOM
Cashflow @ list (25.0% down · 7.5%)
Estimated rent
$1,650/mo
Mortgage (P&I)
−$750
Tax + insurance
−$588
HOA
−$0
Vac / Maint / Mgmt
−$346
Net cashflow
$-34/mo
Annual
$-413/yr
Cap rate
9.58%
Cash-on-cash
11.75%
DSCR
1.52
1% rule
1.15%
Cash to close
$40,040
Investor read
- This is a 3-bed/1.0-bath single-family listed at $143k.
- At list price, monthly cash flow is $-34 ($-413/yr) — negative.
- To cash-flow at today's rent, offer at most $137k (4.3% below list).
- Meets the 1% rule at list price ($2k rent vs $143k).
- Only 1 days on market — expect competitive offers; lowballing is unlikely to land.
- Recommended offer: $137k (4.3% below list) — sets the bar for cash-flow.
- Local home prices are declining (-3.0%/yr); year-one equity from $989 of loan paydown is wiped out by about $4k of value loss. Plan a longer hold.
- Location reads 79/100 on livability (#82 in MI, #1,885 nationally) — a middle-class / working-renter tenant base. Strengths: commute A+, cost of living A+, housing A+; Watch: schools C-, crime D+, employment D+.
- Dearborn Heights School District #7 (suburban): math 13% / reading 26% proficiency, ranked #466 of 540 in MI (top 86%) — low school quality limits family demand, transient renter base, plan for 1-2y turnover; 60% free/reduced lunch — lower-income household profile, screen leases tightly.
- Watch-outs: flood insurance adds $427/mo; built in 1958 — expect roof / HVAC / electrical / plumbing capex.
- Market conditions: Rents rising (+2.0%/yr); 137 active listings in the ZIP; 15 comparable units currently listed for rent nearby; rentals leasing fast (median 11d on market — plan ~1-2 weeks tenant-placement turnaround); 2,639 units permitted in Wayne County in 2024 (1,216 in 5+ unit buildings).
- Wayne County population projected at -17% by 2050 — secular population decline; favor cash flow + early exit over multi-decade hold.
- Climate carrying-cost: in FEMA flood zone AE (mandatory federal flood insurance) — expect insurance premiums to compound above CPI over the hold.
- Cap rate 9.6% vs local median 5.5% in Dearborn Heights — top-decile yield for the area; either an underpriced asset or a hidden risk that comps aren't pricing in. Stress-test before assuming the spread holds.
- This rent runs 33% of the median local income ($60k/yr) — at the standard rent-burdened threshold; future hikes will face affordability resistance.
Questions for listing agent
- What do current leases actually rent for vs. the listed asking? Can we see a recent rent roll and the last 12 months of T-12 income?
- Built in 1958 — when were the roof, HVAC, electrical panel, plumbing, and water heater last replaced?
- What's the actual annual flood-insurance premium (NFIP or private), and is the property in a SFHA with mandatory coverage?
- Is there a deadline driving the sale (1031 exchange, divorce, estate, relocation)? That informs how much negotiation room exists.
- Crime grade is D in this area — have there been break-ins, vandalism, or insurance claims at this property in the last 3 years? What carrier currently insures it and at what premium?
- What's the average days-on-market for RENTAL listings here right now (not sales)? A rising rental-DOM trend means longer vacancies and softer asking-rent achievability than the comps imply.
- What's the recent tenant-quality profile in this submarket — average credit score on applications, eviction rate, late-payment / NSF rate, and stable-employment percentage? A property-management company in the area should have these aggregated.
- How much new for-sale + rental construction is in the pipeline within 1–3 miles? Heavy new supply typically softens prices + rents 12–24 months out; constrained supply supports both.
CashFlowRE · CFR-G9VCF96GZ9F2G9
· Data 1 week ago
cashflowre.app · 2026-05-29