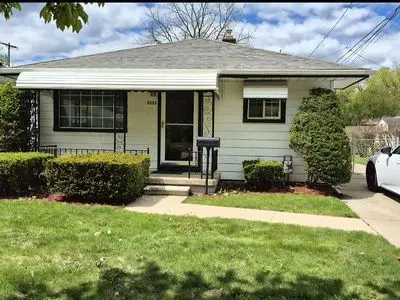
5332 Weddell St · Dearborn Heights, MI
Flood risk 3/10 · Minor
- FEMA flood zone
- AE
- Chance of flooding over 30 yrs
- 0.17%
- Est. flood insurance / yr
- $1,737 – $8,500
Fire risk 1/10 · Minimal
- Est. fire insurance / yr
- $784 – $1,456
Heat risk 3/10 · Minor
- Hot days now (above 97°F)
- 7 days/yr
- Hot days in 30 yrs
- 14 days/yr
Wind risk 2/10 · Minimal
- Chance of severe wind over 30 yrs
- —
Air-quality risk 3/10 · Minor
- Unhealthy air days now
- 2 days/yr
- Unhealthy air days in 30 yrs
- 4 days/yr
Risk factors via First Street. Map © Google.
Why this score? — see what drove the C+ grade
The composite is a weighted blend of 9 inputs, each scored 0–100. Each bar is that input's sub-score; the figure is the points it added to the 100-point composite (weight × sub-score).
- Cash flow +26.8/30.0
- DSCR +9.2/10.0
- ARV discount +8.1/15.0
- 1% rule +6.5/10.0
- Livability +4.0/5.0
- Rent growth +3.0/5.0
- Condition / age +2.5/5.0
- Schools +1.7/10.0
- Appreciation +0.0/10.0
$143,000
🖨 Deal sheet 📄 Offer letter ✓ Due diligence
Listing remarks
Meticulously maintained 3 Bedroom 1 bath ranch home in Dearborn Heights. Solid oak plank flooring under carpet in living room and exposed in all 3 bedrooms. Kitchen and nook with newer custom cabinetry. Attic with new easy access door and some flooring for extra storage. Large laundry/utility room with overhead cabinets. Wallside windows throughout and new Levelor blinds in most windows. Covered front porch and back patio. 2.5 car. garage with work bench, overhead storage and door opener. Newer mechanicals includes new central air conditioner. Wonderful neighborhood close to expressway, schools and shopping. Previous owners loved this home for 60 years and it shows!!!! Perfect starter hom
Key facts
- Covered front porch
- Back patio
Tags
Neighborhood map
What this means for you Summary
Snapshot
- This is a 3-bed/1.0-bath single-family listed at $143k.
Deal economics
- At list price, monthly cash flow is $-34 ($-413/yr) — negative.
- To cash-flow at today's rent, offer at most $137k (4.3% below list).
- Meets the 1% rule at list price ($2k rent vs $143k).
- Recommended offer: $137k (4.3% below list) — sets the bar for cash-flow.
- Cap rate 9.6% vs local median 5.5% in Dearborn Heights — top-decile yield for the area; either an underpriced asset or a hidden risk that comps aren't pricing in. Stress-test before assuming the spread holds.
Location & tenants
- Location reads 79/100 on livability (#82 in MI, #1,885 nationally) — a middle-class / working-renter tenant base. Strengths: commute A+, cost of living A+, housing A+; Watch: schools C-, crime D+, employment D+.
- Dearborn Heights School District #7 (suburban): math 13% / reading 26% proficiency, ranked #466 of 540 in MI (top 86%) — low school quality limits family demand, transient renter base, plan for 1-2y turnover; 60% free/reduced lunch — lower-income household profile, screen leases tightly.
- Market conditions: Rents rising (+2.0%/yr); 137 active listings in the ZIP; 15 comparable units currently listed for rent nearby; rentals leasing fast (median 10d on market — plan ~1-2 weeks tenant-placement turnaround); 2,639 units permitted in Wayne County in 2024 (1,216 in 5+ unit buildings).
- This rent runs 33% of the median local income ($60k/yr) — at the standard rent-burdened threshold; future hikes will face affordability resistance.
Forward outlook
- Local home prices are declining (-3.0%/yr); year-one equity from $989 of loan paydown is wiped out by about $4k of value loss. Plan a longer hold.
- Wayne County population projected at -17% by 2050 — secular population decline; favor cash flow + early exit over multi-decade hold.
Negotiation context
- Only 1 days on market — expect competitive offers; lowballing is unlikely to land.
Risks & watch-outs
- Watch-outs: flood insurance adds $427/mo; built in 1958 — expect roof / HVAC / electrical / plumbing capex.
- Climate carrying-cost: in FEMA flood zone AE (mandatory federal flood insurance) — expect insurance premiums to compound above CPI over the hold.
Questions for the listing agent
- What do current leases actually rent for vs. the listed asking? Can we see a recent rent roll and the last 12 months of T-12 income?
- Built in 1958 — when were the roof, HVAC, electrical panel, plumbing, and water heater last replaced?
- What's the actual annual flood-insurance premium (NFIP or private), and is the property in a SFHA with mandatory coverage?
- Is there a deadline driving the sale (1031 exchange, divorce, estate, relocation)? That informs how much negotiation room exists.
- Crime grade is D in this area — have there been break-ins, vandalism, or insurance claims at this property in the last 3 years? What carrier currently insures it and at what premium?
- What's the average days-on-market for RENTAL listings here right now (not sales)? A rising rental-DOM trend means longer vacancies and softer asking-rent achievability than the comps imply.
- What's the recent tenant-quality profile in this submarket — average credit score on applications, eviction rate, late-payment / NSF rate, and stable-employment percentage? A property-management company in the area should have these aggregated.
- How much new for-sale + rental construction is in the pipeline within 1–3 miles? Heavy new supply typically softens prices + rents 12–24 months out; constrained supply supports both.
Investment metrics
- 1% rule
- 1.15% ✓
- Cap rate
- 9.58%
- Cash-on-cash
- 11.75%
- DSCR
- 1.52
- GRM
- 7.2
CMA / ARV
- ARV (on-the-fly)
- $145,080
- Comps found
- 12
Show comp detail 12 sales within ~0.75 mi
| Address | Dist | Beds/Ba | Sqft | Sold | Price | $/sf | Match |
|---|---|---|---|---|---|---|---|
| 5636 Hipp St | 0.23mi | 3/1.0 | 894 (-4%) | 1mo | $121,300 | $136 | 81 |
| 4932 Pelham St | 0.22mi | 3/1.0 | 1,000 (+7%) | 0mo | $170,000 | $170 | 78 |
| 4694 Ziegler St | 0.22mi | 3/1.0 | 884 (-6%) | 3mo | $144,899 | $164 | 78 |
| 5839 Balfour Ave | 0.44mi | 3/1.0 | 998 (+7%) | 2mo | $150,000 | $150 | 66 |
| 4663 Mayfair St | 0.22mi | 3/1.0 | 1,074 (+15%) | 1mo | $180,000 | $168 | 65 |
| 4993 Clippert St | 0.54mi | 3/1.0 | 988 (+6%) | 2mo | $159,000 | $161 | 64 |
| 4401 Hipp St | 0.43mi | 3/1.5 | 1,011 (+8%) | 2mo | $90,000 | $89 | 63 |
| 4012 Weddell St | 0.54mi | 3/1.0 | 1,007 (+8%) | 1mo | $220,000 | $218 | 61 |
| 4408 Gertrude St | 0.59mi | 3/1.0 | 1,000 (+7%) | 1mo | $155,000 | $155 | 60 |
| 6354 Buckingham Ave | 0.72mi | 2/1.0 (-1) | 910 (-3%) | 3mo | $106,000 | $116 | 54 |
| 4845 Dudley St | 0.69mi | 3/1.0 | 1,020 (+9%) | 1mo | $147,000 | $144 | 52 |
| 4630 Gertrude St | 0.52mi | 2/1.0 (-1) | 839 (-10%) | 2mo | $100,600 | $120 | 52 |
Match score weights: distance 35% · size 25% · config 20% · recency 20%. Top-matched comps best support the ARV.
Projected returns pro-forma
-3.0% appreciation · 2.03% rent growth · sell at horizon
- IRR
- -19.3%
- Equity multiple
- 0.33×
- Total profit
- $-26,722
- Equity at exit
- $21,322
- IRR
- -14.5%
- Equity multiple
- 0.21×
- Total profit
- $-31,539
- Equity at exit
- $12,364
Cash invested: $40,040 (down + closing). Projections, not guarantees.
Landlord ↔ Tenant lean methodology
- Overall (STATE)
- 62 Landlord-Friendly
- State Michigan
- 62 Landlord-Friendly · EVEN
- County
- — inherits STATE
- City
- — inherits STATE
ZIP-level market 48125
- Rents YoY
- 2.0%
- Active inventory
- 137
- Price-to-rent
- 7.2×
Monthly cashflow live
- Estimated rent
- $1,650 high interval (Pro) →
- Mortgage (P&I)
- −$750
- Tax from tax record
- −$102 /mo · $1,222/yr
- Insurance
- −$60
- Flood insurance flood zone
- −$427 /mo · $5,118/yr
- HOA
- −$0
- Vacancy / Maint / Mgmt
- −$346
- Net cashflow
- $-34
Break-even live
UW: 25.0% down · 7.5% · 30yr · 1.5% tax · 5.0% vac · 8.0% maint · 8.0% mgmt
Financing live
Cash to close
- Down payment
- $35,750
- Closing costs
- $4,290
- Reserves months
- —
- Total cash needed
- —
Loan-product check · same deal, 3 products live
Conventional
25% down · 7.5% · 30yr
- Down + closing
- —
- Monthly P&I
- —
- Monthly cashflow
- —
- DSCR
- —
- Eligible?
- —
Personal DTI + credit; lowest rate.
DSCR
20% down · 8.5% · 30yr
- Down + closing
- —
- Monthly P&I
- —
- Monthly cashflow
- —
- DSCR
- —
- Eligible?
- —
No personal income docs; deal must DSCR.
Hard money
10% down · 12.0% · 12mo
- Down + closing
- —
- Monthly P&I
- —
- Monthly cashflow
- —
- DSCR
- —
- Eligible?
- —
Short-term bridge; refi at stabilization.
Rent comps 15 comps
| Address | Beds | Baths | Sqft | Rent | $/sqft | DOM | Units | Dist |
|---|---|---|---|---|---|---|---|---|
| 4704 Jackson St Dearborn Heights, MI | 3.0 | 1.0 | 1000 | $1,500 | $1.50 | 21d | 1 | 0.19mi |
| 4681 Weddell St Dearborn Heights, MI | 3.0 | 1.0 | 860 | $1,600 | $1.86 | 1d | 1 | 0.21mi |
| 4631 Ziegler St Dearborn Heights, MI | 3.0 | 1.0 | 1050 | $1,650 | $1.57 | 43d | 1 | 0.28mi |
| 5371 Culver St Dearborn Heights, MI | 3.0 | 1.0 | 980 | $1,450 | $1.48 | 1d | 1 | 0.46mi |
| 5371 Culver St Dearborn Heights, MI | 3.0 | 1.0 | 980 | $1,500 | $1.53 | 10d | 1 | 0.46mi |
| 4914 Gertrude St Dearborn Heights, MI | 2.0 | 1.0 | 908 | $1,230 | $1.35 | 17d | 1 | 0.48mi |
| 4638 Gertrude St Dearborn Heights, MI | 3.0 | 1.0 | 1020 | $1,700 | $1.67 | 5d | 1 | 0.52mi |
| 4810 Campbell St Dearborn Heights, MI | 3.0 | 1.0 | 1000 | $1,700 | $1.70 | 1d | 1 | 0.55mi |
| 4757 Dudley St Dearborn Heights, MI | 3.0 | 1.0 | 995 | $1,350 | $1.36 | 10d | 1 | 0.70mi |
| 20728 Carlysle St Dearborn, MI | 3.0 | 1.0 | 1087 | $1,850 | $1.70 | 1d | 1 | 0.84mi |
| 4934 McKinley St Dearborn Heights, MI | 3.0 | 1.0 | 1051 | $1,700 | $1.62 | 1d | 1 | 0.96mi |
| 3620 Monroe St Dearborn, MI | 3.0 | 2.0 | 1100 | $1,800 | $1.64 | 10d | 1 | 1.17mi |
| 2631 Woodside St Dearborn, MI | 3.0 | 1.0 | 894 | $1,650 | $1.85 | 1d | 1 | 1.19mi |
| 21337 Audette St Dearborn, MI | 3.0 | 1.0 | 964 | $1,850 | $1.92 | 43d | 1 | 1.41mi |
| 4775 Willow Cove Blvd Allen Park, MI | 1.0–2.0 | 1.0 | 805 | $1,649 | $2.05 | 24d | 4 | 1.46mi |
Listing history 2 events
-
2026-05-13status Under Contract
-
2026-05-12$143,000 Active
ⓘ Source: listings_history table (triggers on properties + properties_extension) + one-shot
backfill from property_details.listing_events for pre-trigger history.
Tax reassessment forecast MI · Partial reset (capped growth)
- Current annual tax
- $1,222 · $102/mo
- Projected year-2 tax
- $1,712 · $143/mo
- Expected delta
- +$490/yr (+$41/mo · 40.1%)
ⓘ Screening estimate from a state-policy table — verify with the county assessor before closing.
Climate risk First Street
- Flood 3/10 Moderate FEMA zone AE · 17% chance over 30 yrs
- Wildfire 1/10 Low
- Heat 3/10 Moderate 7 d/yr ≥97°F today · 14 d/yr by 30 yrs out
- Wind 2/10 Low
- Air quality 3/10 Moderate 2 unhealthy d/yr today · 4 by 30 yrs out
Nearby sold comps map
Loading sold comps map…
Walkable amenities ~0.75 mi
Loading nearby amenities…
Taxation est. · year 1
- Rental income
- $19,799
- − Mortgage interest
- −$8,010
- − Property taxes
- −$1,222
- − Insurance
- −$5,834
- − Repairs & maintenance
- −$1,584
- − Management
- −$1,584
- − Depreciation
- −$4,160
- Taxable loss
- −$2,595
- Est. tax savings @ 24.0%
- +$623
- After-tax cash flow
- $209/yr
For passive investors: Depreciation is non-cash, so a rental often shows a tax loss while cash-flowing — sheltering income. Rental losses are passive: they offset passive income freely, and up to $25,000/yr can offset ordinary (W-2) income if you actively participate and your MAGI is under $100k (phasing out to $0 by $150k); unused losses carry forward. On sale, claimed depreciation is recaptured at up to 25%, and gains may owe capital-gains tax (a 1031 exchange can defer both). Figures are a year-1 estimate at your 24.0% rate — not tax advice; consult a CPA.
Schools (NCES district)
- District
- Dearborn Heights School District #7
- NCES district ID
- 2611610
- Math proficiency
- 13% ▼ -10.00%
- Reading proficiency
- 26% ▼ -7.00%
- Median HH income
- $47,468
- Composite
- 17.21/100
- National rank
- #9101
- State rank
- #466 of 540 in MI
Livability — Dearborn Heights
- Score
- 79/100
- State rank
- #82
- US rank
- #1885
Category grades
Schools grade is shown separately in the Schools card above.
Census & demographics
- Census place
- Dearborn Heights, MI
- County
- Wayne County · 1,562,939 people
- City population
- 61,771
- Metro
- Detroit-Warren-Dearborn, MI
- Population (ZIP)
- 22,125
- Household income
- $60,195
- Rent vs Own
- Severe rent burden
- 654.0
Population outlook (Wayne County) Hauer SSP2
- Today (2025)
- 1,675,273 people
- By 2030
- 1,620,300 · -3.3%
- By 2040
- 1,502,341 · -10.3%
- By 2050
- 1,384,039 · -17.4%
- By 2075
- 1,124,592 · -32.9%
- By 2100
- 881,193 · -47.4%
Race, ethnicity, and origin ACS 2023
- Neighborhood character
- Predominantly White (76%)
- Race & ethnicity
- White 76% Black 10% Two or more races 9% Hispanic / Latino 9%
- Hispanic origin (detail)
- Mexican 6%
- Common ancestry
- Romanian 11% Arab 3% Slovak 2%
- Foreign-born
- 11% · Canada
- Languages at home
- 82% English-only · Arabic 13% Spanish 3% Russian/Polish/Slavic 1%
Political lean MEDSL · Wayne
- 2024 margin
- Strong D (+29.0) · D 62.7% · R 33.7% · Other 3.6%
- 2008→2024 swing
- -20.5pp toward R · 2008: 49.5pp · 2024: 29.0pp
- All cycles
- 2024: D+29.0 2020: D+38.1 2016: D+37.3 2012: D+46.9 2008: D+49.5
Not yet ingested
- Civics
- —
Market trends
- HPI YoY
- ▼ -214.70%
- Current HPI
- 218.4698
- Rent YoY
- ▲ 2.03%
- Metro
- Detroit-Warren-Dearborn, MI
- State GDP YoY
- ▲ 1.37%
- F500 in state
- 28
Industry mix (Fortune 500 HQ in MI)
| Industry | F500 HQs | Revenue |
|---|---|---|
| Automotive Parts | 3 | $48B |
|
||
| Automotive | 2 | $372B |
|
||
| Chemicals | 1 | $45B |
|
||
| Automotive Retail | 1 | $29B |
|
||
| Healthcare / Medical Devices | 1 | $23B |
|
||
| Automotive Technology | 1 | $20B |
|
||
Price history
2 events — show timeline
- 2026-05-13 Pending — FSBO.com
- 2026-05-12 Listed $143,000 FSBO.com
Property tax history
-1.0%/yrLatest (2025): $1,222 · -26.9% YoY. Source: county tax records.
Cash-flow waterfall
monthlySold comps — $/sqft
last 12 mo · ≤1 miLoading sold comps…