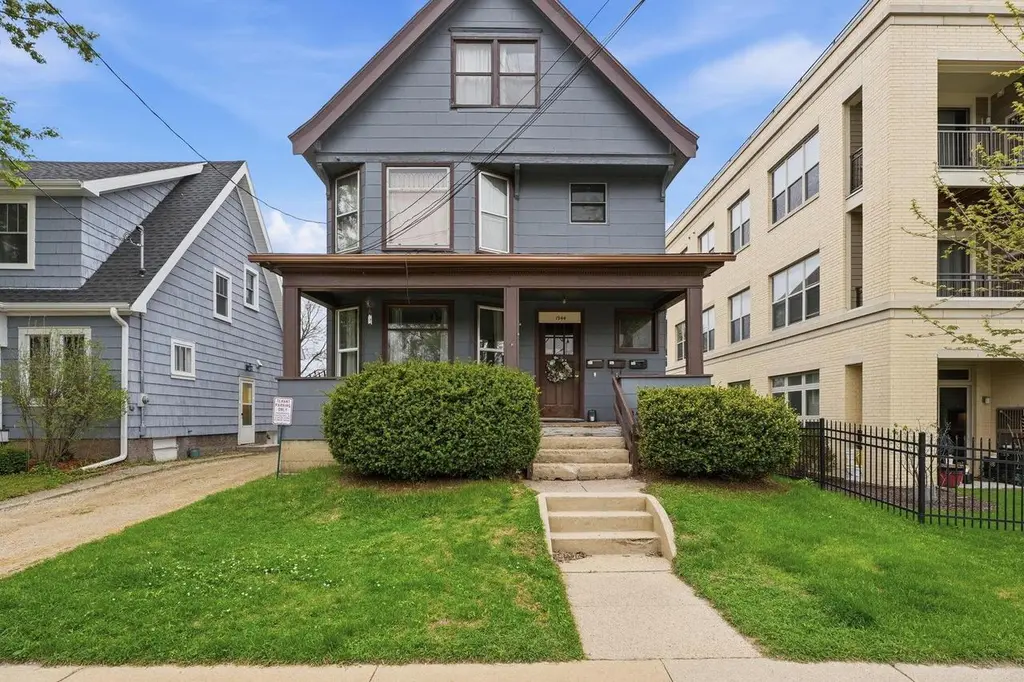
1944 E Washington Ave
Madison, WI 53704
$598,000D+
4 bd · 3.0 ba ·
2,784 sqft ·
Built 1903
· MultiFamily
· Pending
· 5 DOM
Cashflow @ list (25.0% down · 7.5%)
Estimated rent
$5,163/mo
Mortgage (P&I)
−$3,136
Tax + insurance
−$1,084
HOA
−$0
Vac / Maint / Mgmt
−$1,084
Net cashflow
$-142/mo
Annual
$-1,699/yr
Cap rate
6.01%
Cash-on-cash
-1.01%
DSCR
0.95
1% rule
0.86%
Cash to close
$167,440
Investor read
- This is a 3 × 1-bed/?-bath units multifamily listed at $598k.
- At list price, monthly cash flow is $-142 ($-2k/yr) — negative. Per door: $-47/mo.
- To cash-flow at today's rent, offer at most $573k (4.2% below list).
- To meet the 1% rule (rent ≥ 1% of price), the offer needs to be $516k (13.7% below list).
- Only 5 days on market — expect competitive offers; lowballing is unlikely to land.
- Recommended offer: $516k (13.7% below list) — sets the bar for 1% rule.
- Local home prices are declining (-3.0%/yr); year-one equity from $4k of loan paydown is wiped out by about $18k of value loss. Plan a longer hold.
- Location reads 84/100 on livability (#39 in WI, #819 nationally) — a professional / high-income tenant draw. Strengths: commute A+, employment A+, housing A+.
- Madison Metropolitan School District (urban): math 35% / reading 40% proficiency, ranked #193 of 342 in WI (top 56%) — families likely to look elsewhere, expect single-tenant / working-renter base with shorter leases.
- Zoned schools: Emerson Elementary (math 54% / reading 44%, grade D, #257 of 1,041 statewide, top 30%, 351 students, 57% FRL); East High (math 32% / reading 42%, grade F, #123 of 483 statewide, top 28%, 1,649 students, 55% FRL).
- Watch-outs: built in 1903 — expect roof / HVAC / electrical / plumbing capex.
- Market conditions: Rents rising (+1.1%/yr); 141 active listings in the ZIP; 2 comparable units currently listed for rent nearby; 5,519 units permitted in Dane County in 2024 (3,978 in 5+ unit buildings).
- Dane County population projected at +35% by 2050 — long-run rental-demand tailwind backs the buy-and-hold thesis.
- Current owner paid $415k; 44% above their basis — modest negotiation headroom, anchor on the comps not their cost.
- Cap rate 6.0% vs local median 2.4% in Madison — top-decile yield for the area; either an underpriced asset or a hidden risk that comps aren't pricing in. Stress-test before assuming the spread holds.
- At $5,163/mo this rent would consume 84% of the median local household income ($74k/yr) (locally 2064% of renters already pay >50% of income on rent) — very limited rent-growth headroom before tenants either downsize or default.
Questions for listing agent
- What do current leases actually rent for vs. the listed asking? Can we see a recent rent roll and the last 12 months of T-12 income?
- Can we see the unit-by-unit rent roll, current vacancy, and any below-market leases? What's the average tenancy length?
- What capital expenditures (roof, boiler, parking lot, exteriors) have been made in the last 5 years, and what's planned in the next 2?
- Built in 1903 — when were the roof, HVAC, electrical panel, plumbing, and water heater last replaced?
- Is there a deadline driving the sale (1031 exchange, divorce, estate, relocation)? That informs how much negotiation room exists.
- The area grade is low — what's the realistic commute time and amenity access for the typical tenant pool here? Any planned neighborhood developments (good or bad) we should know about?
- What's the average days-on-market for RENTAL listings here right now (not sales)? A rising rental-DOM trend means longer vacancies and softer asking-rent achievability than the comps imply.
- What's the recent tenant-quality profile in this submarket — average credit score on applications, eviction rate, late-payment / NSF rate, and stable-employment percentage? A property-management company in the area should have these aggregated.
CashFlowRE · CFR-GA36FP6PPGCEV6
· Data 3 weeks ago
cashflowre.app · 2026-05-29