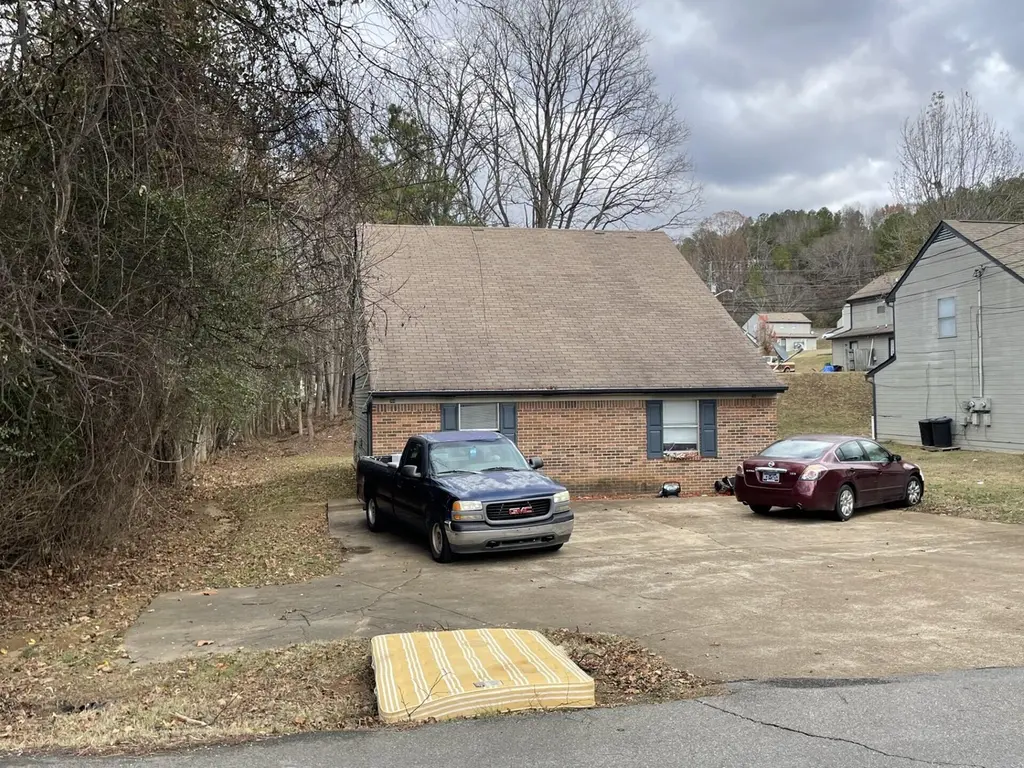
701/705 NE Weeks Dr
Cleveland, TN 37312
$249,900D-
9 bd · 1.5 ba ·
810 sqft ·
Built 1988
· Townhouse
· Pending
· 828 DOM
Cashflow @ list (25.0% down · 7.5%)
Estimated rent
$1,801/mo
Mortgage (P&I)
−$1,311
Tax + insurance
−$178
HOA
−$0
Vac / Maint / Mgmt
−$378
Net cashflow
$-65/mo
Annual
$-784/yr
Cap rate
5.98%
Cash-on-cash
-1.12%
DSCR
0.95
1% rule
0.72%
Cash to close
$69,972
Investor read
- This is a 9-bed/1.5-bath townhouse listed at $250k.
- At list price, monthly cash flow is $-65 ($-784/yr) — negative.
- To cash-flow at today's rent, offer at most $238k (4.6% below list).
- To meet the 1% rule (rent ≥ 1% of price), the offer needs to be $180k (27.9% below list).
- It's been on market 828 days — a 12% lower offer ($220k) is reasonable based on typical stale-listing flexibility.
- Recommended offer: $180k (27.9% below list) — sets the bar for 1% rule.
- Local home prices are declining (-3.0%/yr); year-one equity from $2k of loan paydown is wiped out by about $7k of value loss. Plan a longer hold.
- Location reads 70/100 on livability (#55 in TN) — a middle-class / working-renter tenant base. Strengths: cost of living A+, health & safety A+, housing A; Watch: employment D, crime F, amenities F.
- Cleveland (urban): math 23% / reading 28% proficiency, ranked #85 of 139 in TN (top 61%) — low school quality limits family demand, transient renter base, plan for 1-2y turnover.
- Zoned schools: Mayfield Elementary (math 17% / reading 22%, grade F, #654 of 952 statewide, top 72%, 412 students, 0% FRL); Cleveland Middle (math 25% / reading 26%, grade F, #147 of 333 statewide, top 45%, 1,271 students, 0% FRL); Cleveland High (math 8% / reading 29%, grade F, #208 of 332 statewide, top 63%, 1,842 students, 0% FRL) — zoned schools average 0% FRL vs 53% district-wide (53 pts lower); this property's tenant base skews higher-income than the district average.
- Market conditions: Rents flat; 549 active listings in the ZIP; solid renter incomes; 768 units permitted in Bradley County in 2024 (0 in 5+ unit buildings).
- Bradley County population projected at +21% by 2050 — long-run rental-demand tailwind backs the buy-and-hold thesis.
- 2 sale attempts since 2y ago with the ask held roughly flat each time — persistent listings suggest the price (not the market) is what's stuck; bring a comps-based counter.
- Climate carrying-cost: moderate flood risk; extreme-heat days projected 7→19/yr by 2055 (HVAC capex compounding) — expect insurance premiums to compound above CPI over the hold.
- Cap rate 6.0% vs local median 3.5% in Cleveland — top-decile yield for the area; either an underpriced asset or a hidden risk that comps aren't pricing in. Stress-test before assuming the spread holds.
Questions for listing agent
- What do current leases actually rent for vs. the listed asking? Can we see a recent rent roll and the last 12 months of T-12 income?
- It's been on market 828 days. Have you received any prior offers? Is the seller open to a 28% concession, seller financing, or rate buy-down credit?
- Why hasn't it sold? Are there any deal-killer items the seller is aware of (foundation, flood, title, zoning, code violations)?
- Is there a deadline driving the sale (1031 exchange, divorce, estate, relocation)? That informs how much negotiation room exists.
- Schools are D-rated, which usually means shorter tenancies and higher turnover. Who's the typical renter profile here, and what's been the actual vacancy rate?
- Crime grade is F in this area — have there been break-ins, vandalism, or insurance claims at this property in the last 3 years? What carrier currently insures it and at what premium?
- The area grade is low — what's the realistic commute time and amenity access for the typical tenant pool here? Any planned neighborhood developments (good or bad) we should know about?
- What's the average days-on-market for RENTAL listings here right now (not sales)? A rising rental-DOM trend means longer vacancies and softer asking-rent achievability than the comps imply.
CashFlowRE · CFR-GATSP08QGWFEXZ
· Data 6 days ago
cashflowre.app · 2026-05-29