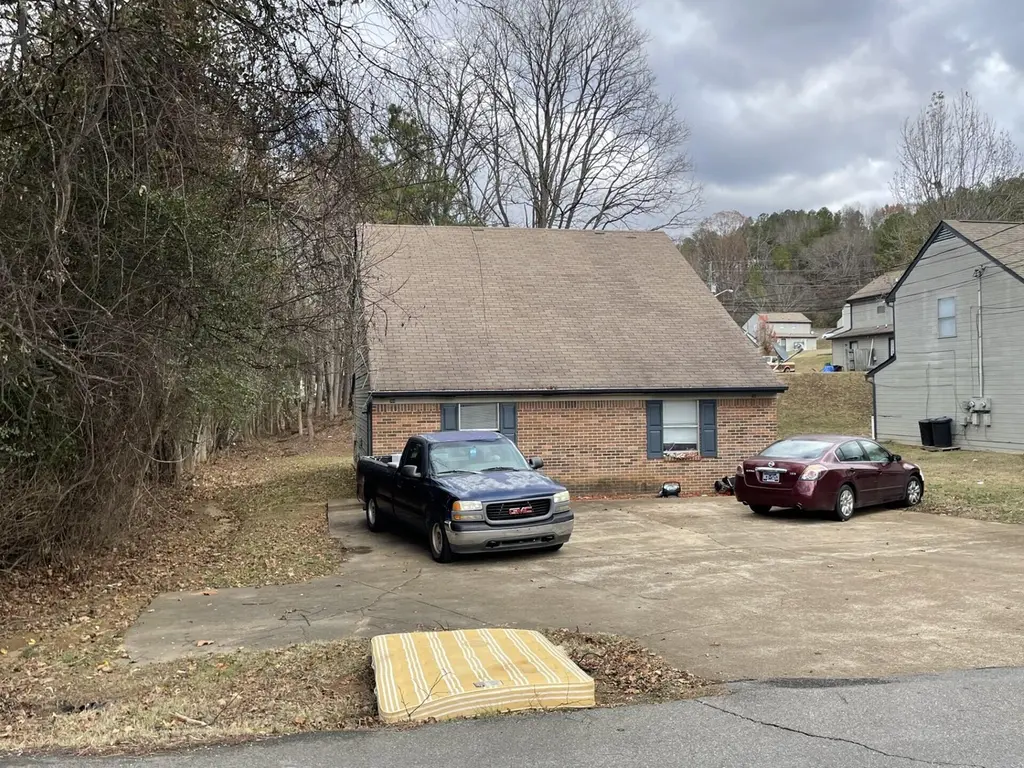
701/705 NE Weeks Dr · Cleveland, TN
Flood risk 5/10 · Moderate
- FEMA flood zone
- X (unshaded)
- Chance of flooding over 30 yrs
- 0.24%
- Est. flood insurance / yr
- $507 – $1,088
Fire risk 3/10 · Minor
- Est. fire insurance / yr
- $949 – $1,763
Heat risk 6/10 · Moderate
- Hot days now (above 104°F)
- 7 days/yr
- Hot days in 30 yrs
- 19 days/yr
Wind risk 3/10 · Minor
- Chance of severe wind over 30 yrs
- 5.0%
Air-quality risk 3/10 · Minor
- Unhealthy air days now
- 2 days/yr
- Unhealthy air days in 30 yrs
- 3 days/yr
Risk factors via First Street. Map © Google.
Why this score? — see what drove the D- grade
The composite is a weighted blend of 9 inputs, each scored 0–100. Each bar is that input's sub-score; the figure is the points it added to the 100-point composite (weight × sub-score).
- Cash flow +11.9/30.0
- ARV discount +7.5/15.0
- DSCR +3.5/10.0
- Livability +3.5/5.0
- Rent growth +2.5/5.0
- Condition / age +2.5/5.0
- 1% rule +2.2/10.0
- Schools +2.1/10.0
- Appreciation +0.0/10.0
$249,900
🖨 Deal sheet 📄 Offer letter ✓ Due diligence
Listing remarks MLS
Great Investment opportunity! Great NE city location. Duplex with 2 bedrooms & 1 1/2 baths, kitchen, living room, washer/dryer hookups. Live in one side & rent the other or build your own 401K. Tenants pay electric, water, & sewer. Get out of the Stock Market & create wealth today.
Key facts
- 4,356 sq ft lot
- Garage
- Built 1988
Property features AI
Finance
- HOA & community: No community features listed
Exterior
- Parking: Has garage; Kitchen-level parking access
- Utilities: Public water
- Home design: Residential income duplex; Two-story
- Construction: Shingle roof; Other construction materials; Slab foundation; Built as a two-story structure
- Exterior features: Level lot; Lot dimensions approximately 162 x 117 feet; Approximately 0.1 acre lot
Interior
- Bathrooms: 2 full bathrooms; 2 half bathrooms
- Interior features: Central heating; Central air conditioning
Neighborhood map
What this means for you Summary
Snapshot
- This is a 9-bed/1.5-bath townhouse listed at $250k.
Deal economics
- At list price, monthly cash flow is $-65 ($-784/yr) — negative.
- To cash-flow at today's rent, offer at most $238k (4.6% below list).
- To meet the 1% rule (rent ≥ 1% of price), the offer needs to be $180k (27.9% below list).
- Recommended offer: $180k (27.9% below list) — sets the bar for 1% rule.
- Cap rate 6.0% vs local median 3.5% in Cleveland — top-decile yield for the area; either an underpriced asset or a hidden risk that comps aren't pricing in. Stress-test before assuming the spread holds.
Location & tenants
- Location reads 70/100 on livability (#55 in TN) — a middle-class / working-renter tenant base. Strengths: cost of living A+, health & safety A+, housing A; Watch: employment D, crime F, amenities F.
- Cleveland (urban): math 23% / reading 28% proficiency, ranked #85 of 139 in TN (top 61%) — low school quality limits family demand, transient renter base, plan for 1-2y turnover.
- Zoned schools: Mayfield Elementary (math 17% / reading 22%, grade F, #654 of 952 statewide, top 72%, 412 students, 0% FRL); Cleveland Middle (math 25% / reading 26%, grade F, #147 of 333 statewide, top 45%, 1,271 students, 0% FRL); Cleveland High (math 8% / reading 29%, grade F, #208 of 332 statewide, top 63%, 1,842 students, 0% FRL) — zoned schools average 0% FRL vs 53% district-wide (53 pts lower); this property's tenant base skews higher-income than the district average.
- Market conditions: Rents flat; 549 active listings in the ZIP; solid renter incomes; 768 units permitted in Bradley County in 2024 (0 in 5+ unit buildings).
Forward outlook
- Local home prices are declining (-3.0%/yr); year-one equity from $2k of loan paydown is wiped out by about $7k of value loss. Plan a longer hold.
- Bradley County population projected at +21% by 2050 — long-run rental-demand tailwind backs the buy-and-hold thesis.
Negotiation context
- It's been on market 828 days — a 12% lower offer ($220k) is reasonable based on typical stale-listing flexibility.
- 2 sale attempts since 2y ago with the ask held roughly flat each time — persistent listings suggest the price (not the market) is what's stuck; bring a comps-based counter.
Risks & watch-outs
- Climate carrying-cost: moderate flood risk; extreme-heat days projected 7→19/yr by 2055 (HVAC capex compounding) — expect insurance premiums to compound above CPI over the hold.
Questions for the listing agent
- What do current leases actually rent for vs. the listed asking? Can we see a recent rent roll and the last 12 months of T-12 income?
- It's been on market 828 days. Have you received any prior offers? Is the seller open to a 28% concession, seller financing, or rate buy-down credit?
- Why hasn't it sold? Are there any deal-killer items the seller is aware of (foundation, flood, title, zoning, code violations)?
- Is there a deadline driving the sale (1031 exchange, divorce, estate, relocation)? That informs how much negotiation room exists.
- Schools are D-rated, which usually means shorter tenancies and higher turnover. Who's the typical renter profile here, and what's been the actual vacancy rate?
- Crime grade is F in this area — have there been break-ins, vandalism, or insurance claims at this property in the last 3 years? What carrier currently insures it and at what premium?
- The area grade is low — what's the realistic commute time and amenity access for the typical tenant pool here? Any planned neighborhood developments (good or bad) we should know about?
- What's the average days-on-market for RENTAL listings here right now (not sales)? A rising rental-DOM trend means longer vacancies and softer asking-rent achievability than the comps imply.
- What's the recent tenant-quality profile in this submarket — average credit score on applications, eviction rate, late-payment / NSF rate, and stable-employment percentage? A property-management company in the area should have these aggregated.
- How much new for-sale + rental construction is in the pipeline within 1–3 miles? Heavy new supply typically softens prices + rents 12–24 months out; constrained supply supports both.
Investment metrics
- 1% rule
- 0.72% ✗
- Cap rate
- 5.98%
- Cash-on-cash
- -1.12%
- DSCR
- 0.95
- GRM
- 11.6
CMA / ARV
No comps found within radius.
Projected returns pro-forma
-3.0% appreciation · 0.15% rent growth · sell at horizon
- IRR
- -21.0%
- Equity multiple
- 0.29×
- Total profit
- $-49,796
- Equity at exit
- $37,261
- IRR
- -21.3%
- Equity multiple
- 0.02×
- Total profit
- $-68,669
- Equity at exit
- $21,607
Cash invested: $69,972 (down + closing). Projections, not guarantees.
Landlord ↔ Tenant lean methodology
- Overall (STATE)
- 87 Strongly Landlord-Friendly
- State Tennessee
- 87 Strongly Landlord-Friendly · R+13
- County
- — inherits STATE
- City
- — inherits STATE
ZIP-level market 37312
- Rents YoY
- 0.1%
- Active inventory
- 549
- Price-to-rent
- 11.6×
Monthly cashflow live
- Estimated rent
- $1,801 medium interval (Pro) →
- Mortgage (P&I)
- −$1,311
- Tax from tax record
- −$74 /mo · $884/yr
- Insurance
- −$104
- HOA
- −$0
- Vacancy / Maint / Mgmt
- −$378
- Net cashflow
- $-65
Break-even live
UW: 25.0% down · 7.5% · 30yr · 1.5% tax · 5.0% vac · 8.0% maint · 8.0% mgmt
Financing live
Cash to close
- Down payment
- $62,475
- Closing costs
- $7,497
- Reserves months
- —
- Total cash needed
- —
Loan-product check · same deal, 3 products live
Conventional
25% down · 7.5% · 30yr
- Down + closing
- —
- Monthly P&I
- —
- Monthly cashflow
- —
- DSCR
- —
- Eligible?
- —
Personal DTI + credit; lowest rate.
DSCR
20% down · 8.5% · 30yr
- Down + closing
- —
- Monthly P&I
- —
- Monthly cashflow
- —
- DSCR
- —
- Eligible?
- —
No personal income docs; deal must DSCR.
Hard money
10% down · 12.0% · 12mo
- Down + closing
- —
- Monthly P&I
- —
- Monthly cashflow
- —
- DSCR
- —
- Eligible?
- —
Short-term bridge; refi at stabilization.
Listing history 4 events
-
2026-05-07historical Active Under Contract 305-char remark
Show marketing remark (305 chars)
Great Investment opportunity! Great NE city location. Duplex with 2 bedrooms & 1 1/2 baths, kitchen, living room, washer/dryer hookups. Live in one side & rent the other or build your own 401K. Tenants pay electric, water, & sewer. Get out of the Stock Market & create wealth today.
-
2026-05-07status Pending
Show marketing remark (305 chars)
Great Investment opportunity! Great NE city location. Duplex with 2 bedrooms & 1 1/2 baths, kitchen, living room, washer/dryer hookups. Live in one side & rent the other or build your own 401K. Tenants pay electric, water, & sewer. Get out of the Stock Market & create wealth today.
-
2024-01-30$249,900 Active
-
2024-01-25$249,900 Active 305-char remark
Show marketing remark (305 chars)
Great Investment opportunity! Great NE city location. Duplex with 2 bedrooms & 1 1/2 baths, kitchen, living room, washer/dryer hookups. Live in one side & rent the other or build your own 401K. Tenants pay electric, water, & sewer. Get out of the Stock Market & create wealth today.
ⓘ Source: listings_history table (triggers on properties + properties_extension) + one-shot
backfill from property_details.listing_events for pre-trigger history.
Tax reassessment forecast TN · Resets to sale price
- Current annual tax
- $884 · $74/mo
- Projected year-2 tax
- $1,774 · $148/mo
- Expected delta
- +$890/yr (+$74/mo · 100.7%)
ⓘ Screening estimate from a state-policy table — verify with the county assessor before closing.
Climate risk First Street
- Flood 5/10 Major FEMA zone X (unshaded) · 24% chance over 30 yrs
- Wildfire 3/10 Moderate
- Heat 6/10 Major 7 d/yr ≥104°F today · 19 d/yr by 30 yrs out
- Wind 3/10 Moderate 5% chance of damaging wind over 30 yrs
- Air quality 3/10 Moderate 2 unhealthy d/yr today · 3 by 30 yrs out
Nearby sold comps map
Loading sold comps map…
Walkable amenities ~0.75 mi
Loading nearby amenities…
Taxation est. · year 1
- Rental income
- $21,615
- − Mortgage interest
- −$13,998
- − Property taxes
- −$884
- − Insurance
- −$1,250
- − Repairs & maintenance
- −$1,729
- − Management
- −$1,729
- − Depreciation
- −$7,270
- Taxable loss
- −$5,245
- Est. tax savings @ 24.0%
- +$1,259
- After-tax cash flow
- $475/yr
For passive investors: Depreciation is non-cash, so a rental often shows a tax loss while cash-flowing — sheltering income. Rental losses are passive: they offset passive income freely, and up to $25,000/yr can offset ordinary (W-2) income if you actively participate and your MAGI is under $100k (phasing out to $0 by $150k); unused losses carry forward. On sale, claimed depreciation is recaptured at up to 25%, and gains may owe capital-gains tax (a 1031 exchange can defer both). Figures are a year-1 estimate at your 24.0% rate — not tax advice; consult a CPA.
Schools (NCES district)
- District
- Cleveland
- NCES district ID
- 4700690
- Math proficiency
- 23% ▼ -9.00%
- Reading proficiency
- 28% ▼ -6.00%
- Median HH income
- $37,612
- Composite
- 21.28/100
- National rank
- #8394
- State rank
- #85 of 139 in TN
Livability — Cleveland
- Score
- 70/100
- State rank
- #55
- US rank
- #7689
Category grades
Schools grade is shown separately in the Schools card above.
Census & demographics
- Census place
- Cleveland, TN
- County
- Bradley County · 99,337 people
- City population
- 99,337
- Metro
- Cleveland, TN
- Population (ZIP)
- 36,669
- Household income
- $78,261
- Rent vs Own
- Severe rent burden
- 908.0
Population outlook (Bradley County) Hauer SSP2
- Today (2025)
- 114,901 people
- By 2030
- 120,137 · +4.6%
- By 2040
- 130,125 · +13.2%
- By 2050
- 139,257 · +21.2%
- By 2075
- 161,664 · +40.7%
- By 2100
- 179,767 · +56.5%
Race, ethnicity, and origin ACS 2023
- Neighborhood character
- Predominantly White (82%)
- Race & ethnicity
- White 82% Hispanic / Latino 7% Two or more races 6% Black 4% Asian 3%
- Hispanic origin (detail)
- Mexican 3% Puerto Rican 1%
- Common ancestry
- Serbian 3% Slovak 2% Italian 2%
- Foreign-born
- 7% · Canada, South Korea
- Languages at home
- 92% English-only · Spanish 4% Other Indo-European 2% Russian/Polish/Slavic 1%
Political lean MEDSL · Bradley
- 2024 margin
- Solid R (+58.9) · D 20.0% · R 78.9% · Other 1.1%
- 2008→2024 swing
- -9.2pp toward R · 2008: -49.7pp · 2024: -58.9pp
- All cycles
- 2024: R+58.9 2020: R+55.3 2016: R+59.1 2012: R+53.9 2008: R+49.7
Not yet ingested
- Civics
- —
Market trends
- HPI YoY
- ▼ -206.27%
- Current HPI
- 260.8746
- Rent YoY
- ▲ 0.15%
- Metro
- Cleveland, TN
- State GDP YoY
- ▲ 2.78%
- F500 in state
- 22
Industry mix (Fortune 500 HQ in TN)
| Industry | F500 HQs | Revenue |
|---|---|---|
| Healthcare | 3 | $91B |
|
||
| Retail | 3 | $72B |
|
||
| Transportation / Logistics | 1 | $88B |
|
||
| Paper / Packaging | 1 | $19B |
|
||
| Insurance | 1 | $13B |
|
||
| Energy | 1 | $12B |
|
||
Price history
+0.0% since first listed4 events — show timeline
- 2026-05-07 Contingent — RCAOR
- 2026-05-07 Pending — GCAR
- 2024-01-30 Listed $249,900 GCAR
- 2024-01-25 Listed $249,900 RCAOR
Property tax history
+5.1%/yrLatest (2025): $884 · +88.5% YoY. Source: county tax records.
Cash-flow waterfall
monthlySold comps — $/sqft
last 12 mo · ≤1 miLoading sold comps…