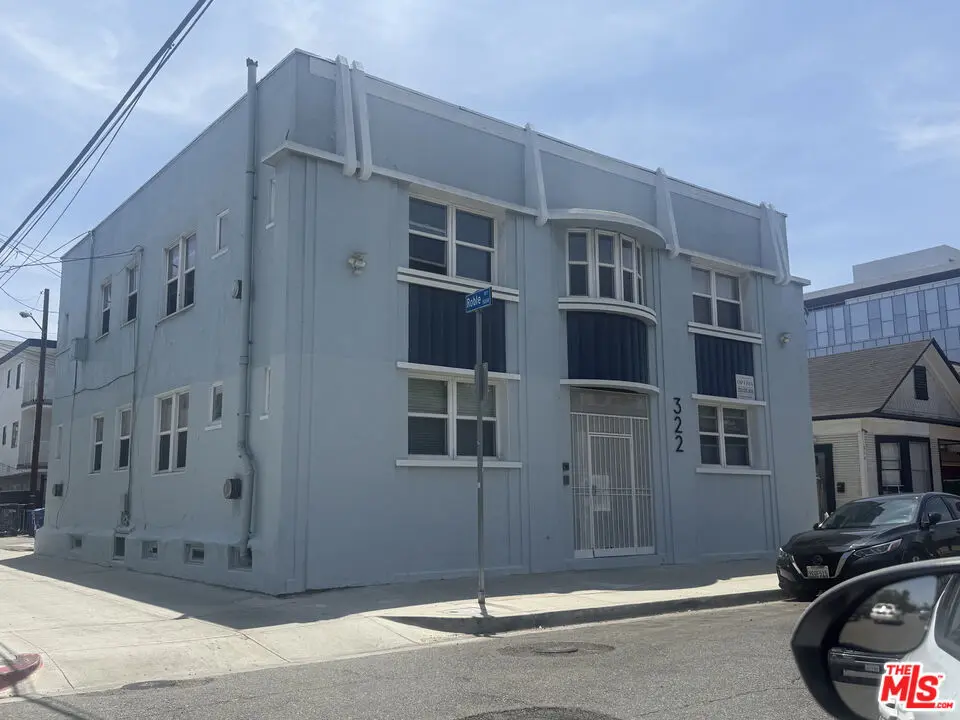
322 Daisy Ave
Long Beach, CA 90802
$1,299,000D-
None bd · 8.0 ba ·
3,520 sqft ·
Built 1923
· MultiFamily
· Active
· 13 DOM
Cashflow @ list (25.0% down · 7.5%)
Estimated rent
$12,394/mo
Mortgage (P&I)
−$6,812
Tax + insurance
−$2,640
HOA
−$0
Vac / Maint / Mgmt
−$2,603
Net cashflow
$339/mo
Annual
$4,074/yr
Cap rate
6.61%
Cash-on-cash
1.12%
DSCR
1.05
1% rule
0.95%
Cash to close
$363,720
Investor read
- This is a ?-bed/8.0-bath multifamily listed at $1.30M.
- At list price, monthly cash flow is $339 ($4k/yr) — positive.
- The deal already cash-flows at list — no discount required.
- To meet the 1% rule (rent ≥ 1% of price), the offer needs to be $1.24M (4.6% below list).
- Only 13 days on market — expect competitive offers; lowballing is unlikely to land.
- Recommended offer: $1.24M (4.6% below list) — sets the bar for 1% rule.
- Local home prices are declining (-3.0%/yr); year-one equity from $9k of loan paydown is wiped out by about $39k of value loss. Plan a longer hold.
- Location reads 67/100 on livability (#319 in CA) — a middle-class / working-renter tenant base. Strengths: amenities A+, commute A+, employment B+; Watch: health & safety C-, crime F, cost of living F.
- Long Beach Unified (urban): math 34% / reading 50% proficiency, ranked #216 of 517 in CA (top 42%) — families likely to look elsewhere, expect single-tenant / working-renter base with shorter leases.
- Zoned schools: Chavez Elementary (math 12%, 337 students, 65% FRL); Washington Middle (math 21% / reading 34%, grade F, #239 of 498 statewide, top 48%, 941 students, 77% FRL); Cabrillo High (math 22% / reading 52%, grade F, #578 of 1,170 statewide, top 51%, 1,786 students, 66% FRL).
- Watch-outs: built in 1923 — expect roof / HVAC / electrical / plumbing capex.
- Market conditions: Rents rising (+1.1%/yr); 205 active listings in the ZIP; 2 comparable units currently listed for rent nearby; 19,697 units permitted in Los Angeles County in 2024 (9,426 in 5+ unit buildings).
- Los Angeles County population projected at +9% by 2050 — modest demand growth; plan on rents tracking national, not racing it.
- 4 sale attempts since 7y ago with the ask held roughly flat each time — persistent listings suggest the price (not the market) is what's stuck; bring a comps-based counter.
- Cap rate 6.6% vs local median 1.9% in Long Beach — top-decile yield for the area; either an underpriced asset or a hidden risk that comps aren't pricing in. Stress-test before assuming the spread holds.
- At $12,394/mo this rent would consume 200% of the median local household income ($75k/yr) (locally 4689% of renters already pay >50% of income on rent) — very limited rent-growth headroom before tenants either downsize or default.
Questions for listing agent
- Built in 1923 — when were the roof, HVAC, electrical panel, plumbing, and water heater last replaced?
- Is there a deadline driving the sale (1031 exchange, divorce, estate, relocation)? That informs how much negotiation room exists.
- Crime grade is F in this area — have there been break-ins, vandalism, or insurance claims at this property in the last 3 years? What carrier currently insures it and at what premium?
- The area grade is low — what's the realistic commute time and amenity access for the typical tenant pool here? Any planned neighborhood developments (good or bad) we should know about?
- What's the average days-on-market for RENTAL listings here right now (not sales)? A rising rental-DOM trend means longer vacancies and softer asking-rent achievability than the comps imply.
- What's the recent tenant-quality profile in this submarket — average credit score on applications, eviction rate, late-payment / NSF rate, and stable-employment percentage? A property-management company in the area should have these aggregated.
- How much new apartment / multifamily construction is in the pipeline within 1–3 miles? Heavy new supply (>2% of stock underway) typically softens rents 12–24 months out; light construction supports rent growth.
CashFlowRE · CFR-GBYYMJ4GE8SM9Y
· Data 1 day ago
cashflowre.app · 2026-05-29