 Multi-family
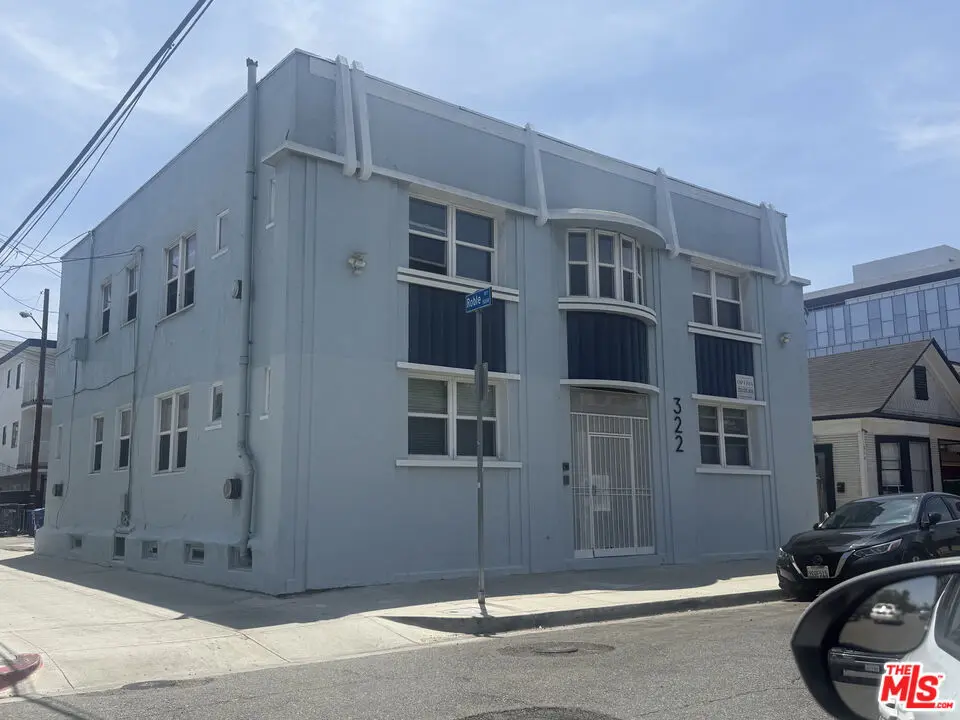
322 Daisy Ave · Long Beach, CA
Flood risk 1/10 · Minimal
- FEMA flood zone
- X (unshaded)
- Chance of flooding over 30 yrs
- 0.0%
- Est. flood insurance / yr
- $507 – $1,088
Fire risk 1/10 · Minimal
- Est. fire insurance / yr
- $659 – $1,223
Heat risk 4/10 · Minor
- Hot days now (above 87°F)
- 7 days/yr
- Hot days in 30 yrs
- 23 days/yr
Wind risk 1/10 · Minimal
- Chance of severe wind over 30 yrs
- —
Air-quality risk 6/10 · Moderate
- Unhealthy air days now
- 9 days/yr
- Unhealthy air days in 30 yrs
- 10 days/yr
Risk factors via First Street. Map © Google.
Why this score? — see what drove the D- grade
The composite is a weighted blend of 9 inputs, each scored 0–100. Each bar is that input's sub-score; the figure is the points it added to the 100-point composite (weight × sub-score).
- Cash flow +14.7/30.0
- 1% rule +4.5/10.0
- DSCR +4.5/10.0
- Schools +3.7/10.0
- Livability +3.4/5.0
- Rent growth +2.8/5.0
- Condition / age +2.5/5.0
- ARV discount +0.0/15.0
- Appreciation +0.0/10.0
$1,299,000
🖨 Deal sheet (PDF) 📄 Offer letter ✓ Due diligence
Multi-family units
County records classify this as Multi-Family (5+ Unit). Listing-text estimate: 1 unit. estimate disagrees with records
5+ unit building — per-unit beds/baths from public records are typically unavailable; the breakdown below (if shown) is an estimate from the listing text.
Listing remarks MLS
We are pleased to offer 322 Daisy Avenue, an 8-unit apartment investment opportunity located in the heart of Downtown Long Beach. The offering at 322 Daisy is located just steps from what the best the city of Long Beach has to offer with endless shops, dinning and entertainment. 322 Daisy offers a near perfect walk score of 90, and excellent transit score of 77, allowing tenants to move throughout the city with ease. The investment opportunity has recently been extensively renovated inside and out. The exterior features new paint and new vinyl windows while interiors receive new vinyl wood plank flooring, new paint, new kitchens and new bathrooms. Perfectly renovated and located, 322 Daisy Avenue is an excellent investment opportunity to own in the heart of Downtown Long Beach.
Key facts
- Downtown long beach
- Walk score of 90
- Mass transportation
Tags
Property features AI
Finance
- Financial info: Gross income approximately $133,500; Gross operating income approximately $129,000; Net operating income approximately $81,000; Total annual expenses approximately $48,000; Cap rate 6.3%; Gross rent multiplier 9.7; Vacancy rate reported at 0%; Actual rental income example: $1,450 per unit (8 like units)
- HOA & community: 8 units in the complex; Located in downtown Long Beach with no local rent control
Exterior
- Parking: No garage
- Home design: Residential income property; Two-level building (2 floors)
- Exterior features: No additional structures on the lot; Zoned LBPD30
Interior
- Bedrooms: Studio / no bedrooms listed (unit type indicates 0 beds for one unit group)
- Bathrooms: Units with 1 bathroom
- Heating & cooling: Wall heat; No central cooling
- Interior features: Wall heating
Neighborhood map
What this means for you Summary
Snapshot
- This is a ?-bed/8.0-bath multifamily listed at $1.30M.
Deal economics
- At list price, monthly cash flow is $339 ($4k/yr) — positive.
- The deal already cash-flows at list — no discount required.
- To meet the 1% rule (rent ≥ 1% of price), the offer needs to be $1.24M (4.6% below list).
- Recommended offer: $1.24M (4.6% below list) — sets the bar for 1% rule.
- Cap rate 6.6% vs local median 1.9% in Long Beach — top-decile yield for the area; either an underpriced asset or a hidden risk that comps aren't pricing in. Stress-test before assuming the spread holds.
Location & tenants
- Location reads 67/100 on livability (#319 in CA) — a middle-class / working-renter tenant base. Strengths: amenities A+, commute A+, employment B+; Watch: health & safety C-, crime F, cost of living F.
- Long Beach Unified (urban): math 34% / reading 50% proficiency, ranked #216 of 517 in CA (top 42%) — families likely to look elsewhere, expect single-tenant / working-renter base with shorter leases.
- Zoned schools: Chavez Elementary (math 12%, 337 students, 65% FRL); Washington Middle (math 21% / reading 34%, grade F, #239 of 498 statewide, top 48%, 941 students, 77% FRL); Cabrillo High (math 22% / reading 52%, grade F, #578 of 1,170 statewide, top 51%, 1,786 students, 66% FRL).
- Market conditions: Rents rising (+1.1%/yr); 205 active listings in the ZIP; 2 comparable units currently listed for rent nearby; 19,697 units permitted in Los Angeles County in 2024 (9,426 in 5+ unit buildings).
- At $12,394/mo this rent would consume 200% of the median local household income ($75k/yr) (locally 4689% of renters already pay >50% of income on rent) — very limited rent-growth headroom before tenants either downsize or default.
Forward outlook
- Local home prices are declining (-3.0%/yr); year-one equity from $9k of loan paydown is wiped out by about $39k of value loss. Plan a longer hold.
- Los Angeles County population projected at +9% by 2050 — modest demand growth; plan on rents tracking national, not racing it.
Negotiation context
- Only 13 days on market — expect competitive offers; lowballing is unlikely to land.
- 4 sale attempts since 7y ago with the ask held roughly flat each time — persistent listings suggest the price (not the market) is what's stuck; bring a comps-based counter.
Risks & watch-outs
- Watch-outs: built in 1923 — expect roof / HVAC / electrical / plumbing capex.
Questions for the listing agent
- Built in 1923 — when were the roof, HVAC, electrical panel, plumbing, and water heater last replaced?
- Is there a deadline driving the sale (1031 exchange, divorce, estate, relocation)? That informs how much negotiation room exists.
- Crime grade is F in this area — have there been break-ins, vandalism, or insurance claims at this property in the last 3 years? What carrier currently insures it and at what premium?
- The area grade is low — what's the realistic commute time and amenity access for the typical tenant pool here? Any planned neighborhood developments (good or bad) we should know about?
- What's the average days-on-market for RENTAL listings here right now (not sales)? A rising rental-DOM trend means longer vacancies and softer asking-rent achievability than the comps imply.
- What's the recent tenant-quality profile in this submarket — average credit score on applications, eviction rate, late-payment / NSF rate, and stable-employment percentage? A property-management company in the area should have these aggregated.
- How much new apartment / multifamily construction is in the pipeline within 1–3 miles? Heavy new supply (>2% of stock underway) typically softens rents 12–24 months out; light construction supports rent growth.
Investment metrics
- 1% rule
- 0.95% ✗
- Cap rate
- 6.61%
- Cash-on-cash
- 1.12%
- DSCR
- 1.05
- GRM
- 8.7
CMA / ARV
- ARV (on-the-fly)
- $1,112,320
- Comps found
- 3
Show comp detail 3 sales within ~0.75 mi
| Address | Dist | Beds/Ba | Sqft | Sold | Price | $/sf | Match |
|---|---|---|---|---|---|---|---|
| 529 W 10th | 0.58mi | 8/6.0 | 3,616 (+3%) | 3mo | $1,425,000 | $394 | 57 |
| 807 Daisy Ave | 0.41mi | 8/6.0 | 3,558 (+1%) | 22mo | $989,900 | $278 | 53 |
| 1036 Chestnut Ave | 0.63mi | 7/7.0 | 3,770 (+7%) | 14mo | $1,190,000 | $316 | 43 |
Match score weights: distance 35% · size 25% · config 20% · recency 20%. Top-matched comps best support the ARV.
Projected returns pro-forma
-3.0% appreciation · 1.14% rent growth · sell at horizon
- IRR
- -16.7%
- Equity multiple
- 0.42×
- Total profit
- $-211,167
- Equity at exit
- $193,685
- IRR
- -12.4%
- Equity multiple
- 0.33×
- Total profit
- $-244,117
- Equity at exit
- $112,314
Cash invested: $363,720 (down + closing). Projections, not guarantees.
Landlord ↔ Tenant lean methodology
- Overall (STATE)
- 18 Strongly Tenant-Friendly
- State California
- 18 Strongly Tenant-Friendly · D+13
- County
- — inherits STATE
- City
- — inherits STATE
ZIP-level market 90802
- Home prices YoY
- -26.1%
- Rents YoY
- 1.1%
- Active inventory
- 205
- Price-to-rent
- 69.9×
Monthly cashflow live
- Estimated rent
- $12,394 high interval (Pro) →
- Mortgage (P&I)
- −$6,812
- Tax from tax record
- −$2,098 /mo · $25,181/yr
- Insurance
- −$541
- HOA
- −$0
- Vacancy / Maint / Mgmt
- −$2,603
- Net cashflow
- $339
Break-even live
Sensitivity live
| Price | -10% $1,075 | -5% $707 | +0% $339 | +5% $-28 | +10% $-396 |
|---|---|---|---|---|---|
| Rent | -10% $-640 | -5% $-150 | +0% $339 | +5% $829 | +10% $1,319 |
| Rate | -1.0pp $994 | -0.5pp $670 | base $339 | +0.5pp $3 | +1.0pp $-340 |
8-unit breakdown (identical units grouped — click to expand)
| Units | Beds | Baths | Est. rent |
|---|---|---|---|
| 8× units | 1 | 1 | $12,392 |
| #1 | 1 | 1 | $1,549 |
| #2 | 1 | 1 | $1,549 |
| #3 | 1 | 1 | $1,549 |
| #4 | 1 | 1 | $1,549 |
| #5 | 1 | 1 | $1,549 |
| #6 | 1 | 1 | $1,549 |
| #7 | 1 | 1 | $1,549 |
| #8 | 1 | 1 | $1,549 |
| Total (8 units) | $12,394 | ||
UW: 25.0% down · 7.5% · 30yr · 1.5% tax · 5.0% vac · 8.0% maint · 8.0% mgmt
Financing live
Cash to close
- Down payment
- $324,750
- Closing costs
- $38,970
- Reserves months
- —
- Total cash needed
- —
Loan-product check · same deal, 3 products live
Conventional
25% down · 7.5% · 30yr
- Down + closing
- —
- Monthly P&I
- —
- Monthly cashflow
- —
- DSCR
- —
- Eligible?
- —
Personal DTI + credit; lowest rate.
DSCR
20% down · 8.5% · 30yr
- Down + closing
- —
- Monthly P&I
- —
- Monthly cashflow
- —
- DSCR
- —
- Eligible?
- —
No personal income docs; deal must DSCR.
Hard money
10% down · 12.0% · 12mo
- Down + closing
- —
- Monthly P&I
- —
- Monthly cashflow
- —
- DSCR
- —
- Eligible?
- —
Short-term bridge; refi at stabilization.
Rent comps 2 comps
| Address | Beds | Baths | Sqft | Rent | $/sqft | DOM | Units | Dist |
|---|---|---|---|---|---|---|---|---|
| 500 W Broadway Long Beach, CA | 3.0 | 1.0–3.0 | 1677 | $3,169 | $1.89 | 0d | 13 | 0.14mi |
| 1487 Henderson Ave Long Beach, CA | 2.0 | 1.0 | 3520 | $2,395 | $0.68 | 45d | 1 | 1.03mi |
Listing history 9 events
-
2026-06-21days on market $1,299,000 Active 13 DOM
-
2026-06-18days on market $1,299,000 Active 10 DOM
-
2026-06-17days on market $1,299,000 Active 9 DOM
-
2026-06-16days on market $1,299,000 Active 8 DOM
-
2026-06-15days on market $1,299,000 Active 7 DOM
-
2026-06-13days on market $1,299,000 Active 5 DOM
-
2026-06-13days on market $1,299,000 Active 4 DOM
-
2026-06-08remarks 699-char remark
-
2026-06-08$1,299,000 Active 1 DOM
ⓘ Source: listings_history table (triggers on properties + properties_extension) + one-shot
backfill from property_details.listing_events for pre-trigger history.
Tax reassessment forecast CA · Resets to sale price
- Current annual tax
- $25,181 · $2,098/mo
- Projected year-2 tax
- $25,181 · $2,098/mo
- Expected delta
- $0/yr ($0/mo · 0.0%)
ⓘ Screening estimate from a state-policy table — verify with the county assessor before closing.
Climate risk First Street
- Flood 1/10 Low FEMA zone X (unshaded) · 0% chance over 30 yrs
- Wildfire 1/10 Low
- Heat 4/10 Moderate 7 d/yr ≥87°F today · 23 d/yr by 30 yrs out
- Wind 1/10 Low
- Air quality 6/10 Major 9 unhealthy d/yr today · 10 by 30 yrs out
Nearby sold comps map
Loading sold comps map…
Walkable amenities ~0.75 mi
Loading nearby amenities…
Taxation est. · year 1
- Rental income
- $148,728
- − Mortgage interest
- −$72,764
- − Property taxes
- −$25,181
- − Insurance
- −$6,495
- − Repairs & maintenance
- −$11,898
- − Management
- −$11,898
- − Depreciation
- −$37,789
- Taxable loss
- −$17,298
- Est. tax savings @ 24.0%
- +$4,151
- After-tax cash flow
- $8,225/yr
For passive investors: Depreciation is non-cash, so a rental often shows a tax loss while cash-flowing — sheltering income. Rental losses are passive: they offset passive income freely, and up to $25,000/yr can offset ordinary (W-2) income if you actively participate and your MAGI is under $100k (phasing out to $0 by $150k); unused losses carry forward. On sale, claimed depreciation is recaptured at up to 25%, and gains may owe capital-gains tax (a 1031 exchange can defer both). Figures are a year-1 estimate at your 24.0% rate — not tax advice; consult a CPA.
Schools (NCES district)
- District
- Long Beach Unified
- NCES district ID
- 0622500
- Math proficiency
- 34% ▼ -11.00%
- Reading proficiency
- 50% ▼ -4.00%
- Median HH income
- $56,092
- Composite
- 36.67/100
- National rank
- #4607
- State rank
- #216 of 517 in CA
Livability — Long Beach
- Score
- 67/100
- State rank
- #319
- US rank
- #10758
Category grades
Schools grade is shown separately in the Schools card above.
Census & demographics
- Census place
- Long Beach, CA
- County
- Los Angeles County · 9,444,647 people
- City population
- 466,088
- Metro
- Los Angeles-Long Beach-Anaheim, CA
- Population (ZIP)
- 40,434
- Household income
- $74,510
- Rent vs Own
- Severe rent burden
- 4689.0
Population outlook (Los Angeles County) Hauer SSP2
- Today (2025)
- 10,940,515 people
- By 2030
- 11,256,481 · +2.9%
- By 2040
- 11,729,929 · +7.2%
- By 2050
- 11,948,407 · +9.2%
- By 2075
- 11,818,114 · +8.0%
- By 2100
- 10,842,928 · -0.9%
Race, ethnicity, and origin ACS 2023
- Neighborhood character
- Highly diverse neighborhood (Simpson 0.72)
- Race & ethnicity
- Hispanic / Latino 37% White 32% Black 15% Two or more races 14% Asian 8% Native American 1%
- Hispanic origin (detail)
- Mexican 27% Puerto Rican 1%
- Common ancestry
- Romanian 2% Lithuanian 2% Estonian 2%
- Foreign-born
- 20% · Canada, China, South Korea
- Languages at home
- 64% English-only · Spanish 27% Other Indo-European 3% Tagalog/Filipino 2%
Political lean MEDSL · Los Angeles
- 2024 margin
- Solid D (+32.9) · D 64.8% · R 31.9% · Other 3.3%
- 2008→2024 swing
- -7.4pp toward R · 2008: 40.4pp · 2024: 32.9pp
- All cycles
- 2024: D+32.9 2020: D+44.2 2016: D+48.0 2012: D+40.0 2008: D+40.4
Not yet ingested
- Civics
- —
Market trends
- HPI YoY
- ▼ -134.40%
- Current HPI
- 380.7305
- Rent YoY
- ▲ 1.14%
- Metro
- Los Angeles-Long Beach-Anaheim, CA
- State GDP YoY
- ▲ 3.21%
- F500 in state
- 116
Industry mix (Fortune 500 HQ in CA)
| Industry | F500 HQs | Revenue |
|---|---|---|
| Technology | 27 | $1,492B |
|
||
| Financial Services | 3 | $174B |
|
||
| Retail | 3 | $44B |
|
||
| Insurance | 3 | $26B |
|
||
| Media / Entertainment | 2 | $115B |
|
||
| Pharmaceuticals / Biotech | 2 | $62B |
|
||
Price history
+549.5% since first listed12 events — show timeline
- 2026-06-08 Listed $1,299,000 TheMLS
- 2023-11-30 Rental Removed $1,299 APPFOLIO
- 2023-11-10 Price Changed $1,299 APPFOLIO
- 2023-10-14 Listed for Rent $1,350 APPFOLIO
- 2019-06-25 Sold (Public Records) $1,680,000 Public Records
- 2019-06-25 Sold (MLS) $1,680,000 SDMLS
- 2019-06-25 Sold (MLS) $1,680,000 CRMLS
- 2019-05-14 Pending — CRMLS
- 2019-02-12 Listed $1,750,000 SDMLS
- 2019-02-12 Listed $1,750,000 CRMLS
- 2018-04-25 Sold (Public Records) $1,000,000 Public Records
- 1993-12-17 Sold (Public Records) $200,000 Public Records
Property tax history
+14.0%/yrLatest (2025): $25,181 · +4.5% YoY. Source: county tax records.
Cash-flow waterfall
monthlySold comps — $/sqft
last 12 mo · ≤1 miLoading sold comps…