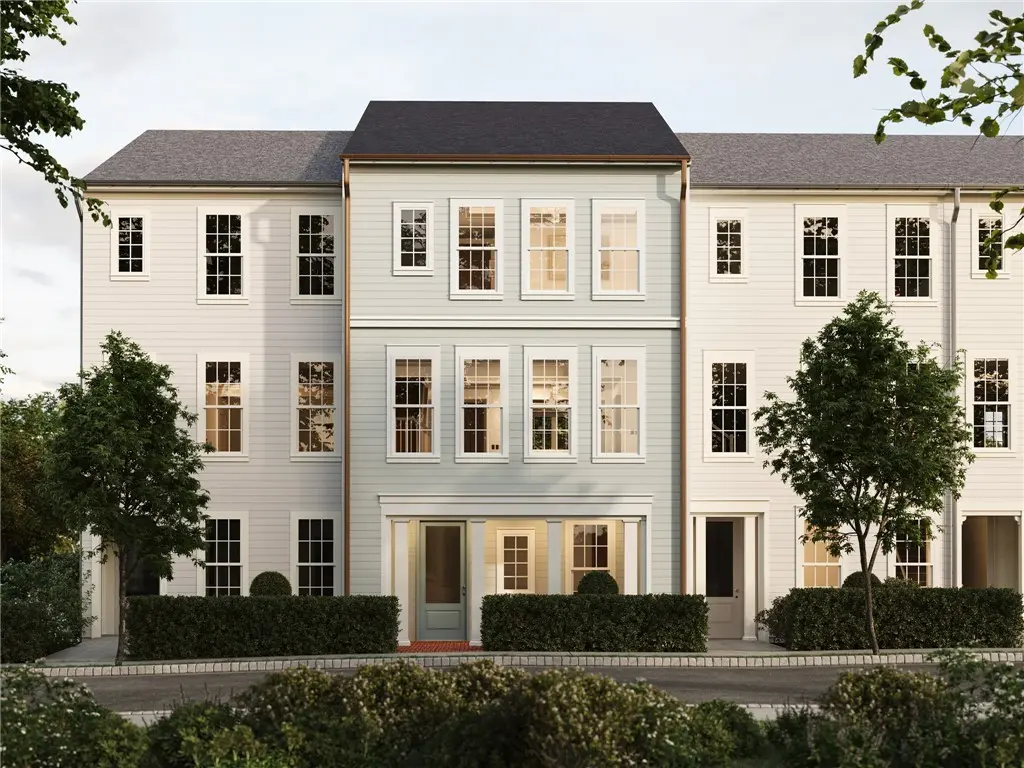
802 Calan St
Seven Fields, PA 16066
$566,990D
3 bd · 2.5 ba ·
2,495 sqft ·
Built 2026
· Townhouse
· Pending
· 15 DOM
Cashflow @ list (25.0% down · 7.5%)
Estimated rent
$4,807/mo
Mortgage (P&I)
−$2,973
Tax + insurance
−$945
HOA
−$0
Vac / Maint / Mgmt
−$1,009
Net cashflow
$-121/mo
Annual
$-1,454/yr
Cap rate
6.04%
Cash-on-cash
-0.92%
DSCR
0.96
1% rule
0.85%
Cash to close
$158,757
Investor read
- This is a 3-bed/2.5-bath townhouse listed at $567k. Condition is rated excellent.
- At list price, monthly cash flow is $-121 ($-1k/yr) — negative.
- To cash-flow at today's rent, offer at most $549k (3.1% below list).
- To meet the 1% rule (rent ≥ 1% of price), the offer needs to be $481k (15.2% below list).
- It's been on market 15 days — a 2% lower offer ($558k) is reasonable based on typical stale-listing flexibility.
- Recommended offer: $481k (15.2% below list) — sets the bar for 1% rule.
- Local home prices are declining (-3.0%/yr); year-one equity from $4k of loan paydown is wiped out by about $17k of value loss. Plan a longer hold.
- Location reads 79/100 on livability (#266 in PA, #2,336 nationally) — a middle-class / working-renter tenant base. Strengths: crime A+, employment A+, housing A+; Watch: amenities D+, health & safety D, commute F.
- Seneca Valley SD (rural): math 48% / reading 67% proficiency, ranked #73 of 539 in PA (top 14%) — acceptable for families but not a draw, mixed tenant base, ~2y average lease; only 12% free/reduced lunch — higher-income household profile.
- Zoned schools: Rowan El Sch (math 62% / reading 77%, grade A-, #151 of 1,518 statewide, top 12%, 527 students, 14% FRL); Ryan Gloyer Ms (math 32% / reading 64%, grade C-, #153 of 512 statewide, top 30%, 1,123 students, 21% FRL); Seneca Valley Hs (math 71% / reading 75%, grade B+, #35 of 437 statewide, top 8%, 2,307 students, 18% FRL).
- Market conditions: Rents soft (-1.9%/yr); 289 active listings in the ZIP; 11 comparable units currently listed for rent nearby; rentals at typical pace (median 15d on market — plan ~3-4 weeks tenant-placement turnaround); high-income renter base; 987 units permitted in Butler County in 2024 (0 in 5+ unit buildings).
- Butler County population projected to shrink 5% by 2050 — rents likely to lag national; underwrite the cash flow, not the appreciation.
- Cap rate 6.0% vs local median 3.4% in Seven Fields — top-decile yield for the area; either an underpriced asset or a hidden risk that comps aren't pricing in. Stress-test before assuming the spread holds.
- At $4,807/mo this rent would consume 46% of the median local household income ($124k/yr) (locally 536% of renters already pay >50% of income on rent) — very limited rent-growth headroom before tenants either downsize or default.
Questions for listing agent
- What do current leases actually rent for vs. the listed asking? Can we see a recent rent roll and the last 12 months of T-12 income?
- Is there a deadline driving the sale (1031 exchange, divorce, estate, relocation)? That informs how much negotiation room exists.
- Schools are B-rated — typically a magnet for longer-tenancy family renters. What's the average tenant stay here, and is there a school-zone premium baked into asking?
- The area grade is low — what's the realistic commute time and amenity access for the typical tenant pool here? Any planned neighborhood developments (good or bad) we should know about?
- What's the average days-on-market for RENTAL listings here right now (not sales)? A rising rental-DOM trend means longer vacancies and softer asking-rent achievability than the comps imply.
- What's the recent tenant-quality profile in this submarket — average credit score on applications, eviction rate, late-payment / NSF rate, and stable-employment percentage? A property-management company in the area should have these aggregated.
- How much new for-sale + rental construction is in the pipeline within 1–3 miles? Heavy new supply typically softens prices + rents 12–24 months out; constrained supply supports both.
CashFlowRE · CFR-GCBSPTEF5H8J5X
· Data 3 weeks ago
cashflowre.app · 2026-05-29