802 Calan St · Seven Fields, PA
Flood risk 1/10 · Minimal
- FEMA flood zone
- X (unshaded)
- Chance of flooding over 30 yrs
- 0.0%
- Est. flood insurance / yr
- $507 – $1,088
Fire risk 1/10 · Minimal
- Est. fire insurance / yr
- $511 – $949
Heat risk 3/10 · Minor
- Hot days now (above 96°F)
- 6 days/yr
- Hot days in 30 yrs
- 15 days/yr
Wind risk 1/10 · Minimal
- Chance of severe wind over 30 yrs
- —
Air-quality risk 3/10 · Minor
- Unhealthy air days now
- 3 days/yr
- Unhealthy air days in 30 yrs
- 5 days/yr
Risk factors via First Street. Map © Google.
Why this score? — see what drove the D grade
The composite is a weighted blend of 9 inputs, each scored 0–100. Each bar is that input's sub-score; the figure is the points it added to the 100-point composite (weight × sub-score).
- Cash flow +12.1/30.0
- ARV discount +8.8/15.0
- Schools +5.2/10.0
- Condition / age +4.8/5.0
- Livability +4.0/5.0
- DSCR +3.6/10.0
- 1% rule +3.5/10.0
- Rent growth +2.0/5.0
- Appreciation +0.0/10.0
$566,990
🖨 Deal sheet (PDF) 📄 Offer letter ✓ Due diligence
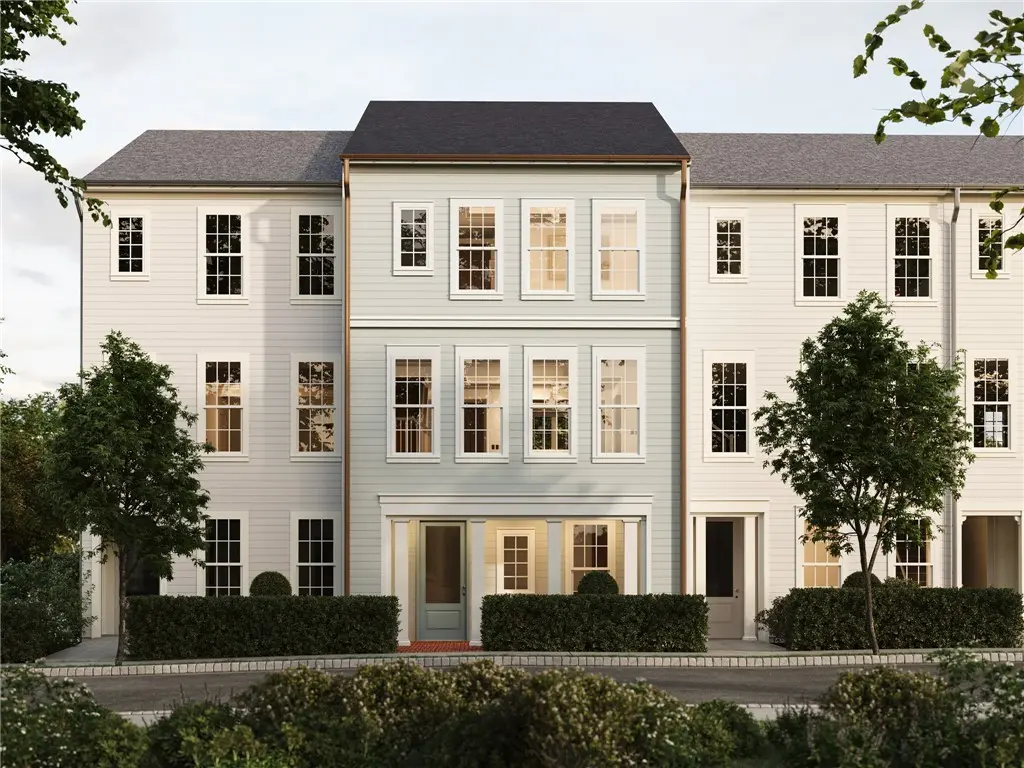
Listing remarks
Last chance to own this popular floorplan—ready for a summer move-in in the newest phase of Crescent. This brand-new townhome combines style, flexibility, and thoughtful design. A welcoming entry and professionally landscaped exterior create a warm first impression. Inside, 9’ ceilings and an open layout set the stage for modern living. The main level features a spacious great room, private study, and a chef-inspired kitchen with Harbor-painted cabinetry, a slate-stained island, and quartz countertops—flowing seamlessly into the dining area and out to a private balcony, perfect for entertaining or relaxing. The lower level adds everyday convenience with a versatile game ro
Key facts
- Private balcony
- Private study
- Versatile game room
Tags
Neighborhood map
What this means for you Summary
Snapshot
- This is a 3-bed/2.5-bath townhouse listed at $567k. Condition is rated excellent.
Deal economics
- At list price, monthly cash flow is $-121 ($-1k/yr) — negative.
- To cash-flow at today's rent, offer at most $549k (3.1% below list).
- To meet the 1% rule (rent ≥ 1% of price), the offer needs to be $481k (15.2% below list).
- Recommended offer: $481k (15.2% below list) — sets the bar for 1% rule.
- Cap rate 6.0% vs local median 3.4% in Seven Fields — top-decile yield for the area; either an underpriced asset or a hidden risk that comps aren't pricing in. Stress-test before assuming the spread holds.
Location & tenants
- Location reads 79/100 on livability (#266 in PA, #2,336 nationally) — a middle-class / working-renter tenant base. Strengths: crime A+, employment A+, housing A+; Watch: amenities D+, health & safety D, commute F.
- Seneca Valley SD (rural): math 48% / reading 67% proficiency, ranked #73 of 539 in PA (top 14%) — acceptable for families but not a draw, mixed tenant base, ~2y average lease; only 12% free/reduced lunch — higher-income household profile.
- Zoned schools: Rowan El Sch (math 62% / reading 77%, grade A-, #151 of 1,518 statewide, top 12%, 527 students, 14% FRL); Ryan Gloyer Ms (math 32% / reading 64%, grade C-, #153 of 512 statewide, top 30%, 1,123 students, 21% FRL); Seneca Valley Hs (math 71% / reading 75%, grade B+, #35 of 437 statewide, top 8%, 2,307 students, 18% FRL).
- Market conditions: Rents soft (-1.9%/yr); 289 active listings in the ZIP; 11 comparable units currently listed for rent nearby; rentals at typical pace (median 14d on market — plan ~3-4 weeks tenant-placement turnaround); high-income renter base; 987 units permitted in Butler County in 2024 (0 in 5+ unit buildings).
- At $4,807/mo this rent would consume 46% of the median local household income ($124k/yr) (locally 536% of renters already pay >50% of income on rent) — very limited rent-growth headroom before tenants either downsize or default.
Forward outlook
- Local home prices are declining (-3.0%/yr); year-one equity from $4k of loan paydown is wiped out by about $17k of value loss. Plan a longer hold.
- Butler County population projected to shrink 5% by 2050 — rents likely to lag national; underwrite the cash flow, not the appreciation.
Negotiation context
- It's been on market 15 days — a 2% lower offer ($558k) is reasonable based on typical stale-listing flexibility.
Questions for the listing agent
- What do current leases actually rent for vs. the listed asking? Can we see a recent rent roll and the last 12 months of T-12 income?
- Is there a deadline driving the sale (1031 exchange, divorce, estate, relocation)? That informs how much negotiation room exists.
- Schools are B-rated — typically a magnet for longer-tenancy family renters. What's the average tenant stay here, and is there a school-zone premium baked into asking?
- The area grade is low — what's the realistic commute time and amenity access for the typical tenant pool here? Any planned neighborhood developments (good or bad) we should know about?
- What's the average days-on-market for RENTAL listings here right now (not sales)? A rising rental-DOM trend means longer vacancies and softer asking-rent achievability than the comps imply.
- What's the recent tenant-quality profile in this submarket — average credit score on applications, eviction rate, late-payment / NSF rate, and stable-employment percentage? A property-management company in the area should have these aggregated.
- How much new for-sale + rental construction is in the pipeline within 1–3 miles? Heavy new supply typically softens prices + rents 12–24 months out; constrained supply supports both.
Investment metrics
- 1% rule
- 0.85% ✗
- Cap rate
- 6.04%
- Cash-on-cash
- -0.92%
- DSCR
- 0.96
- GRM
- 9.8
CMA / ARV
- ARV (on-the-fly)
- $583,830
- Comps found
- 12
Show comp detail 12 sales within ~0.75 mi
| Address | Dist | Beds/Ba | Sqft | Sold | Price | $/sf | Match |
|---|---|---|---|---|---|---|---|
| 405 Ramsgate Rd | 0.17mi | 3/2.5 | 2,495 (0%) | 7mo | $599,990 | $240 | 86 |
| 340 Highbridge Ln | 0.13mi | 3/2.5 | 2,494 (-0%) | 10mo | $559,990 | $225 | 86 |
| 324 Highbridge Ln | 0.15mi | 3/2.5 | 2,495 (0%) | 9mo | $524,260 | $210 | 85 |
| 302 Highbridge Ln | 0.18mi | 3/2.5 | 2,738 (+10%) | 6mo | $641,990 | $234 | 70 |
| 304 Highbridge Ln | 0.18mi | 3/2.5 | 2,738 (+10%) | 8mo | $639,990 | $234 | 69 |
| 248 Limehouse Rd | 0.31mi | 3/3.0 | 2,258 (-10%) | 1mo | $539,000 | $239 | 67 |
| 247 Limehouse Rd | 0.29mi | 3/2.5 | 2,215 (-11%) | 3mo | $499,900 | $226 | 66 |
| 423 Ramsgate Rd | 0.15mi | 3/2.5 | 2,131 (-15%) | 4mo | $542,990 | $255 | 66 |
| 511 High Crescent Rd | 0.21mi | 3/2.5 | 2,738 (+10%) | 11mo | $632,990 | $231 | 65 |
| 503 High Crescent Rd | 0.23mi | 3/2.5 | 2,738 (+10%) | 11mo | $624,990 | $228 | 64 |
| 328 Highbridge Ln | 0.15mi | 3/2.5 | 2,131 (-15%) | 9mo | $487,770 | $229 | 61 |
| 338 Highbridge Ln | 0.14mi | 4/3.5 (+1) | 2,161 (-13%) | 6mo | $540,990 | $250 | 57 |
Match score weights: distance 35% · size 25% · config 20% · recency 20%. Top-matched comps best support the ARV.
Projected returns pro-forma
-3.0% appreciation · 0.0% rent growth · sell at horizon
- IRR
- -21.2%
- Equity multiple
- 0.28×
- Total profit
- $-113,609
- Equity at exit
- $84,540
- IRR
- -23.9%
- Equity multiple
- -0.03×
- Total profit
- $-163,011
- Equity at exit
- $49,023
Cash invested: $158,757 (down + closing). Projections, not guarantees.
Landlord ↔ Tenant lean methodology
- Overall (STATE)
- 62 Landlord-Friendly
- State Pennsylvania
- 62 Landlord-Friendly · EVEN
- County
- — inherits STATE
- City
- — inherits STATE
ZIP-level market 16066
- Rents YoY
- -1.9%
- Active inventory
- 289
- Price-to-rent
- 9.8×
Monthly cashflow live
- Estimated rent
- $4,807 high interval (Pro) →
- Mortgage (P&I)
- −$2,973
- Tax est. 1.5%
- −$709 /mo · $8,505/yr
- Insurance
- −$236
- HOA
- −$0
- Vacancy / Maint / Mgmt
- −$1,009
- Net cashflow
- $-121
Break-even live
Sensitivity live
| Price | -10% $271 | -5% $75 | +0% $-121 | +5% $-317 | +10% $-513 |
|---|---|---|---|---|---|
| Rent | -10% $-501 | -5% $-311 | +0% $-121 | +5% $69 | +10% $259 |
| Rate | -1.0pp $164 | -0.5pp $23 | base $-121 | +0.5pp $-268 | +1.0pp $-418 |
UW: 25.0% down · 7.5% · 30yr · 1.5% tax · 5.0% vac · 8.0% maint · 8.0% mgmt
Financing live
Cash to close
- Down payment
- $141,748
- Closing costs
- $17,010
- Reserves months
- —
- Total cash needed
- —
Loan-product check · same deal, 3 products live
Conventional
25% down · 7.5% · 30yr
- Down + closing
- —
- Monthly P&I
- —
- Monthly cashflow
- —
- DSCR
- —
- Eligible?
- —
Personal DTI + credit; lowest rate.
DSCR
20% down · 8.5% · 30yr
- Down + closing
- —
- Monthly P&I
- —
- Monthly cashflow
- —
- DSCR
- —
- Eligible?
- —
No personal income docs; deal must DSCR.
Hard money
10% down · 12.0% · 12mo
- Down + closing
- —
- Monthly P&I
- —
- Monthly cashflow
- —
- DSCR
- —
- Eligible?
- —
Short-term bridge; refi at stabilization.
Rent comps 11 comps
| Address | Beds | Baths | Sqft | Rent | $/sqft | DOM | Units | Dist |
|---|---|---|---|---|---|---|---|---|
| 509 High Crescent Rd Cranberry Township, PA | 3.0 | 2.5 | 3170 | $5,500 | $1.74 | 25d | 1 | 0.20mi |
| 228 Limehouse Rd Cranberry Township, PA | 3.0 | 3.0 | 2000 | $6,500 | $3.25 | 45d | 1 | 0.29mi |
| 219 Limehouse Rd Cranberry Township, PA | 3.0 | 2.5 | 2200 | $7,500 | $3.41 | 45d | 1 | 0.32mi |
| 1000 Creekview Cir Cranberry Township, PA | 2.0 | 1.0–2.0 | 1244 | $2,767 | $2.22 | 3d | 16 | 0.92mi |
| 5001 Pendleton Way Cranberry Twp, PA | 1.0–3.0 | 1.0–3.0 | 1459 | $4,673 | $3.20 | 3d | 27 | 0.95mi |
| 8000 Brandt Dr Cranberry Twp, PA | 1.0–3.0 | 1.0–2.0 | 1193 | $2,776 | $2.33 | 3d | 26 | 1.03mi |
| 305 Frederick Way Cranberry Twp, PA | 3.0 | 3.5 | 1748 | $3,200 | $1.83 | 45d | 1 | 1.12mi |
| 114 Main St Cranberry Township, PA | 4.0 | 3.5 | 2900 | $5,995 | $2.07 | 14d | 1 | 1.15mi |
| 233 Main St Cranberry Township, PA | 3.0 | 2.5 | 1778 | $2,995 | $1.68 | 6d | 1 | 1.17mi |
| 417 Roebling Ct Cranberry Township, PA | 3.0 | 2.5 | 2500 | $3,100 | $1.24 | 5d | 1 | 1.27mi |
| 816 Graywyck Dr Seven Fields, PA | 4.0 | 3.5 | 2512 | $3,200 | $1.27 | 18d | 1 | 1.44mi |
Listing history 2 events
-
2026-04-08status Pending
-
2026-03-24$566,990 Active
ⓘ Source: listings_history table (triggers on properties + properties_extension) + one-shot
backfill from property_details.listing_events for pre-trigger history.
Climate risk First Street
- Flood 1/10 Low FEMA zone X (unshaded) · 0% chance over 30 yrs
- Wildfire 1/10 Low
- Heat 3/10 Moderate 6 d/yr ≥96°F today · 15 d/yr by 30 yrs out
- Wind 1/10 Low
- Air quality 3/10 Moderate 3 unhealthy d/yr today · 5 by 30 yrs out
Nearby sold comps map
Loading sold comps map…
Walkable amenities ~0.75 mi
Loading nearby amenities…
Taxation est. · year 1
- Rental income
- $57,678
- − Mortgage interest
- −$31,760
- − Property taxes
- −$8,505
- − Insurance
- −$2,835
- − Repairs & maintenance
- −$4,614
- − Management
- −$4,614
- − Depreciation
- −$16,494
- Taxable loss
- −$11,145
- Est. tax savings @ 24.0%
- +$2,675
- After-tax cash flow
- $1,220/yr
For passive investors: Depreciation is non-cash, so a rental often shows a tax loss while cash-flowing — sheltering income. Rental losses are passive: they offset passive income freely, and up to $25,000/yr can offset ordinary (W-2) income if you actively participate and your MAGI is under $100k (phasing out to $0 by $150k); unused losses carry forward. On sale, claimed depreciation is recaptured at up to 25%, and gains may owe capital-gains tax (a 1031 exchange can defer both). Figures are a year-1 estimate at your 24.0% rate — not tax advice; consult a CPA.
Condition & rehab AI · 14 photos
This brand-new townhome is in excellent condition with modern finishes and a well-maintained exterior. It is ready for immediate move-in and offers a great value for both resale and rental.
Value-add opportunities
- Both Landscaping and pond maintenance — Enhances curb appeal and adds value for both resale and rental.
- Both Painting exterior and interior walls — Fresh paint can improve the home's appearance and increase its value.
- Both Landscaping and pond maintenance — Enhances curb appeal and adds value for both resale and rental.
Renovation cost estimate screening
Value-add ROI direction
- Both Landscaping and pond maintenance — Enhances curb appeal and adds value for both resale and rental. ↑
- Both Painting exterior and interior walls — Fresh paint can improve the home's appearance and increase its value. ↑
- Both Landscaping and pond maintenance — Enhances curb appeal and adds value for both resale and rental. ↑
ⓘ Cost ranges are severity-bucket heuristics (US national rule-of-thumb). Get contractor quotes + a written scope before underwriting a rehab budget.
Schools (NCES district)
- District
- Seneca Valley SD
- NCES district ID
- 4222440
- Math proficiency
- 48% ▼ -15.00%
- Reading proficiency
- 67% ▼ -12.00%
- Median HH income
- $80,381
- Composite
- 51.84/100
- National rank
- #1666
- State rank
- #73 of 539 in PA
Livability — Seven Fields
- Score
- 79/100
- State rank
- #266
- US rank
- #2336
Category grades
Schools grade is shown separately in the Schools card above.
Census & demographics
- County
- Butler County · 73,107 people
- Metro
- Pittsburgh, PA
- Population (ZIP)
- 33,873
- Household income
- $124,189
- Rent vs Own
- Severe rent burden
- 536.0
Population outlook (Butler County) Hauer SSP2
- Today (2025)
- 190,777 people
- By 2030
- 191,476 · +0.4%
- By 2040
- 189,474 · -0.7%
- By 2050
- 182,050 · -4.6%
- By 2075
- 159,526 · -16.4%
- By 2100
- 129,028 · -32.4%
Race, ethnicity, and origin ACS 2023
- Neighborhood character
- Predominantly White (90%)
- Race & ethnicity
- White 90% Asian 4% Two or more races 3% Hispanic / Latino 2% Black 1%
- Common ancestry
- Romanian 10% Slovak 1% Italian 1%
- Foreign-born
- 5% · Canada, China
- Languages at home
- 93% English-only · Other Indo-European 2% Spanish 1% Other Asian/Pacific 1%
Political lean MEDSL · Butler
- 2024 margin
- Solid R (+32.2) · D 33.5% · R 65.7%
- 2008→2024 swing
- -4.8pp toward R · 2008: -27.4pp · 2024: -32.2pp
- All cycles
- 2024: R+32.2 2020: R+32.5 2016: R+37.5 2012: R+34.9 2008: R+27.4
Not yet ingested
- Civics
- —
Market trends
- HPI YoY
- ▼ -154.35%
- Current HPI
- 276.4597
- Rent YoY
- ▼ -1.93%
- Metro
- Pittsburgh, PA
- State GDP YoY
- ▲ 1.68%
- F500 in state
- 34
Industry mix (Fortune 500 HQ in PA)
| Industry | F500 HQs | Revenue |
|---|---|---|
| Healthcare | 2 | $309B |
|
||
| Insurance | 2 | $27B |
|
||
| Telecommunications / Media | 1 | $124B |
|
||
| Industrial Distribution | 1 | $22B |
|
||
| Financial Services | 1 | $20B |
|
||
| Chemicals / Materials | 1 | $18B |
|
||
Price history
2 events — show timeline
- 2026-04-08 Pending — West Penn MLS
- 2026-03-24 Listed $566,990 West Penn MLS
Cash-flow waterfall
monthlySold comps — $/sqft
last 12 mo · ≤1 miLoading sold comps…