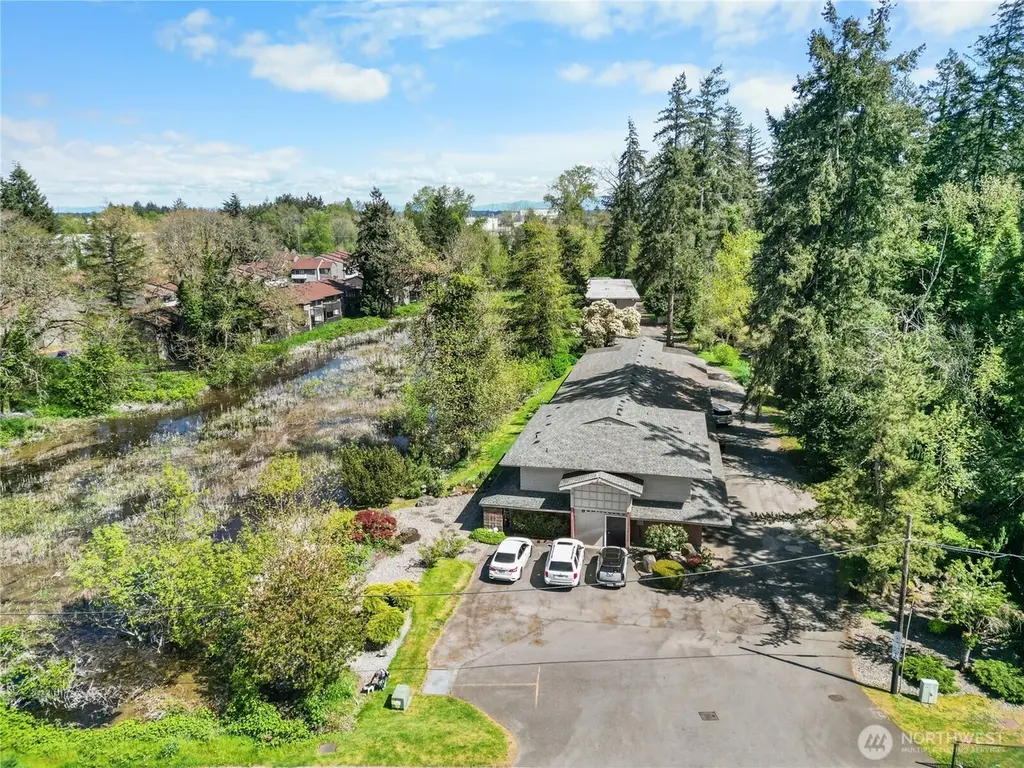
12413 Bridgeport Way SW
Lakewood, WA 98499
$1,900,000C-
308 bd · 210.0 ba ·
6,292 sqft ·
Built 1972
· MultiFamily
· Active
· 23 DOM
Cashflow @ list (25.0% down · 7.5%)
Estimated rent
$20,040/mo
Mortgage (P&I)
−$9,964
Tax + insurance
−$3,410
HOA
−$0
Vac / Maint / Mgmt
−$4,208
Net cashflow
$2,457/mo
Annual
$29,490/yr
Cap rate
8.11%
Cash-on-cash
6.51%
DSCR
1.29
1% rule
1.05%
Cash to close
$532,000
Investor read
- This is a 1×4bd/3ba + 1×3bd/1ba + 3×2bd/1ba units multifamily listed at $1.90M.
- At list price, monthly cash flow is $2k ($29k/yr) — positive. Per door: $176/mo.
- The deal already cash-flows at list — no discount required.
- Meets the 1% rule at list price ($20k rent vs $1.90M).
- It's been on market 23 days — a 2% lower offer ($1.87M) is reasonable based on typical stale-listing flexibility.
- Recommended offer: $1.87M (1.5% below list) — sets the bar for market timing.
- Local home prices are declining (-3.0%/yr); year-one equity from $13k of loan paydown is wiped out by about $57k of value loss. Plan a longer hold.
- Location reads 74/100 on livability (#182 in WA, #4,754 nationally) — a middle-class / working-renter tenant base. Strengths: commute A+, health & safety A+, housing A-; Watch: schools C-, cost of living D, crime F.
- Clover Park School District (urban): math 39% / reading 51% proficiency, ranked #190 of 291 in WA (top 65%) — families likely to look elsewhere, expect single-tenant / working-renter base with shorter leases.
- Watch-outs: flood insurance adds $427/mo.
- Market conditions: Rents rising (+3.0%/yr); 129 active listings in the ZIP; 3,209 units permitted in Pierce County in 2024 (1,269 in 5+ unit buildings).
- Pierce County population projected at +26% by 2050 — long-run rental-demand tailwind backs the buy-and-hold thesis.
- 9 sale attempts since 3y ago with the ask held roughly flat each time — persistent listings suggest the price (not the market) is what's stuck; bring a comps-based counter.
- Current owner paid $408k; list at $1.90M implies a 366% gain — meaningful room to come down on a strong offer.
- Climate carrying-cost: in FEMA flood zone AE (mandatory federal flood insurance) — expect insurance premiums to compound above CPI over the hold.
- Cap rate 8.1% vs local median 2.6% in Lakewood — top-decile yield for the area; either an underpriced asset or a hidden risk that comps aren't pricing in. Stress-test before assuming the spread holds.
- At $20,040/mo this rent would consume 357% of the median local household income ($67k/yr) (locally 2313% of renters already pay >50% of income on rent) — very limited rent-growth headroom before tenants either downsize or default.
Questions for listing agent
- Can we see the unit-by-unit rent roll, current vacancy, and any below-market leases? What's the average tenancy length?
- What capital expenditures (roof, boiler, parking lot, exteriors) have been made in the last 5 years, and what's planned in the next 2?
- Built in 1972 — when were the roof, HVAC, electrical panel, plumbing, and water heater last replaced?
- What's the actual annual flood-insurance premium (NFIP or private), and is the property in a SFHA with mandatory coverage?
- Is there a deadline driving the sale (1031 exchange, divorce, estate, relocation)? That informs how much negotiation room exists.
- Crime grade is F in this area — have there been break-ins, vandalism, or insurance claims at this property in the last 3 years? What carrier currently insures it and at what premium?
- What's the average days-on-market for RENTAL listings here right now (not sales)? A rising rental-DOM trend means longer vacancies and softer asking-rent achievability than the comps imply.
- What's the recent tenant-quality profile in this submarket — average credit score on applications, eviction rate, late-payment / NSF rate, and stable-employment percentage? A property-management company in the area should have these aggregated.
CashFlowRE · CFR-GCMB0W4PDFFDE9
· Data 2 days ago
cashflowre.app · 2026-05-29