 14-Plex
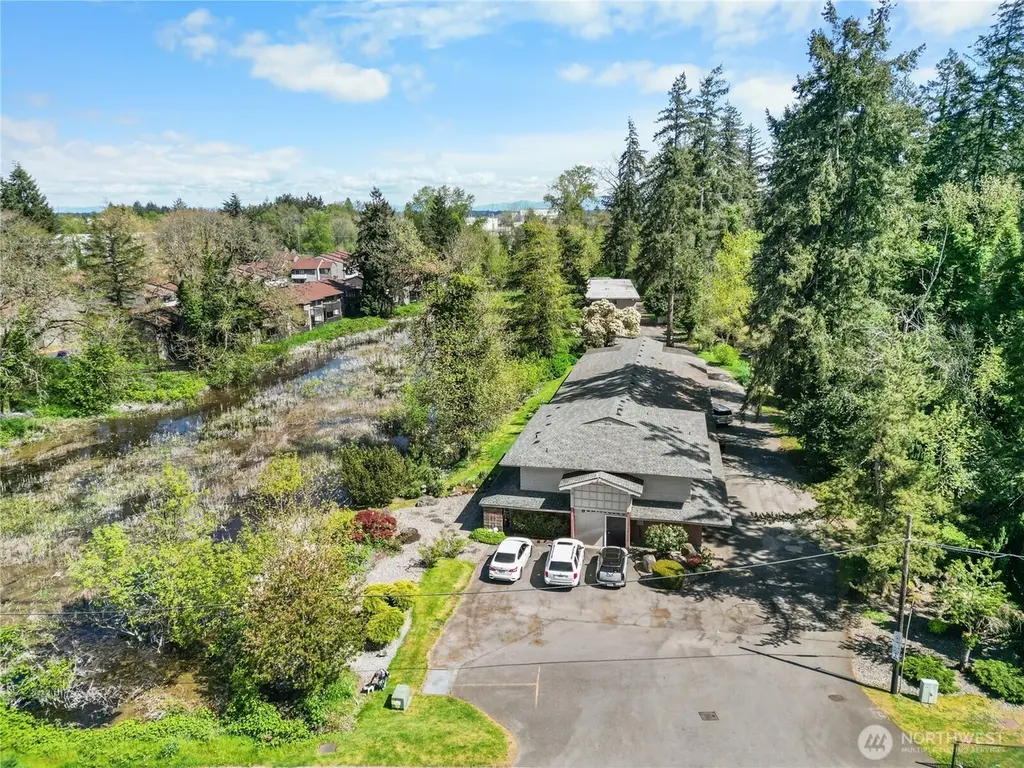
12413 Bridgeport Way SW · Lakewood, WA
Flood risk 9/10 · Severe
- FEMA flood zone
- AE
- Chance of flooding over 30 yrs
- 0.99%
- Est. flood insurance / yr
- $1,737 – $8,500
Fire risk 1/10 · Minimal
- Est. fire insurance / yr
- $604 – $1,122
Heat risk 3/10 · Minor
- Hot days now (above 87°F)
- 7 days/yr
- Hot days in 30 yrs
- 14 days/yr
Wind risk 1/10 · Minimal
- Chance of severe wind over 30 yrs
- —
Air-quality risk 6/10 · Moderate
- Unhealthy air days now
- 9 days/yr
- Unhealthy air days in 30 yrs
- 9 days/yr
Risk factors via First Street. Map © Google.
Why this score? — see what drove the C- grade
The composite is a weighted blend of 9 inputs, each scored 0–100. Each bar is that input's sub-score; the figure is the points it added to the 100-point composite (weight × sub-score).
- Cash flow +21.6/30.0
- ARV discount +7.5/15.0
- DSCR +6.9/10.0
- 1% rule +5.5/10.0
- Schools +4.0/10.0
- Livability +3.7/5.0
- Rent growth +3.2/5.0
- Condition / age +2.5/5.0
- Appreciation +0.0/10.0
$1,900,000
🖨 Deal sheet 📄 Offer letter ✓ Due diligence
Multi-family units
County records classify this as Multi-Family (5+ Unit). Listing-text estimate: 14 units. confirmed
5+ unit building — per-unit beds/baths from public records are typically unavailable; the breakdown below (if shown) is an estimate from the listing text.
Listing remarks
Gen Villas is a cash-flowing value-add 14-unit apartment community situated on 2.62 acres in a serene creek-side setting surrounded by lush greenery in Lakewood, located less than 2 miles from Joint Base Lewis-McChord, Pierce County’s largest employer. The property consists of 14 units across two separate buildings: a 6-unit building located at the front of the property, originally constructed in 1972, and an 8-unit building situated at the rear of the property, built in 1955. The unit mix includes one 4-bedroom / 3-bathroom unit, one 3-bedroom / 1-bathroom unit, three 2-bedroom / 1-bathroom units, and nine 1-bedroom / 1-bathroom apartments. Seven units at the property have been updat
Key facts
- Updated units
- Fresh interior paint
- 2.62 acre lot
Tags
Property features AI
Finance
- Other: Possible use: Multi-family; Zoning jurisdiction: City; Lot size about 2.62 acres
- Financial info: Property used as multi-family income; 14 total units; Gross scheduled income: $221,400; Gross adjusted income: $210,339; Total monthly income: $19,743; Net operating income: $112,092; Total expenses: $113,763; Insurance expense: $11,770; Other expense: $48,298; Gross rent multiplier: 8.58; Vacancy rate: 5%
Exterior
- Parking: 6 covered spaces; 6 carport spaces; 19 uncovered parking spaces
- Utilities: Electric service; Sewer connected
- Home design: Residential income property — multi-family building; 3 stories
- Construction: Composition roof; Construction materials: see remarks; Property condition listed as good
- Exterior features: See remarks for exterior features
Interior
- Kitchen: Refrigerators provided in units (as noted for multiple unit types)
- Bedrooms: Unit mix includes 4-bedroom units and multiple 1–3 bedroom units across the property
- Flooring: See remarks for flooring details
- Bathrooms: Combination of 1- and 3-bathroom units depending on unit type
- Heating & cooling: Property has heating (see remarks for details); No central cooling
- Interior features: See remarks for additional interior details
- Laundry & utility: Washer and dryer available in several unit types
Neighborhood map
What this means for you Summary
Snapshot
- This is a 1×4bd/3ba + 1×3bd/1ba + 3×2bd/1ba units multifamily listed at $1.90M.
Deal economics
- At list price, monthly cash flow is $2k ($29k/yr) — positive. Per door: $176/mo.
- The deal already cash-flows at list — no discount required.
- Meets the 1% rule at list price ($20k rent vs $1.90M).
- Recommended offer: $1.87M (1.5% below list) — sets the bar for market timing.
- Cap rate 8.1% vs local median 2.6% in Lakewood — top-decile yield for the area; either an underpriced asset or a hidden risk that comps aren't pricing in. Stress-test before assuming the spread holds.
Location & tenants
- Location reads 74/100 on livability (#182 in WA, #4,754 nationally) — a middle-class / working-renter tenant base. Strengths: commute A+, health & safety A+, housing A-; Watch: schools C-, cost of living D, crime F.
- Clover Park School District (urban): math 39% / reading 51% proficiency, ranked #190 of 291 in WA (top 65%) — families likely to look elsewhere, expect single-tenant / working-renter base with shorter leases.
- Market conditions: Rents rising (+3.0%/yr); 129 active listings in the ZIP; 3,209 units permitted in Pierce County in 2024 (1,269 in 5+ unit buildings).
- At $20,040/mo this rent would consume 357% of the median local household income ($67k/yr) (locally 2313% of renters already pay >50% of income on rent) — very limited rent-growth headroom before tenants either downsize or default.
Forward outlook
- Local home prices are declining (-3.0%/yr); year-one equity from $13k of loan paydown is wiped out by about $57k of value loss. Plan a longer hold.
- Pierce County population projected at +26% by 2050 — long-run rental-demand tailwind backs the buy-and-hold thesis.
Negotiation context
- It's been on market 23 days — a 2% lower offer ($1.87M) is reasonable based on typical stale-listing flexibility.
- 9 sale attempts since 3y ago with the ask held roughly flat each time — persistent listings suggest the price (not the market) is what's stuck; bring a comps-based counter.
- Current owner paid $408k; list at $1.90M implies a 366% gain — meaningful room to come down on a strong offer.
Risks & watch-outs
- Watch-outs: flood insurance adds $427/mo.
- Climate carrying-cost: in FEMA flood zone AE (mandatory federal flood insurance) — expect insurance premiums to compound above CPI over the hold.
Questions for the listing agent
- Can we see the unit-by-unit rent roll, current vacancy, and any below-market leases? What's the average tenancy length?
- What capital expenditures (roof, boiler, parking lot, exteriors) have been made in the last 5 years, and what's planned in the next 2?
- Built in 1972 — when were the roof, HVAC, electrical panel, plumbing, and water heater last replaced?
- What's the actual annual flood-insurance premium (NFIP or private), and is the property in a SFHA with mandatory coverage?
- Is there a deadline driving the sale (1031 exchange, divorce, estate, relocation)? That informs how much negotiation room exists.
- Crime grade is F in this area — have there been break-ins, vandalism, or insurance claims at this property in the last 3 years? What carrier currently insures it and at what premium?
- What's the average days-on-market for RENTAL listings here right now (not sales)? A rising rental-DOM trend means longer vacancies and softer asking-rent achievability than the comps imply.
- What's the recent tenant-quality profile in this submarket — average credit score on applications, eviction rate, late-payment / NSF rate, and stable-employment percentage? A property-management company in the area should have these aggregated.
- How much new apartment / multifamily construction is in the pipeline within 1–3 miles? Heavy new supply (>2% of stock underway) typically softens rents 12–24 months out; light construction supports rent growth.
Investment metrics
- 1% rule
- 1.05% ✓
- Cap rate
- 8.11%
- Cash-on-cash
- 6.51%
- DSCR
- 1.29
- GRM
- 7.9
CMA / ARV
No comps found within radius.
Projected returns pro-forma
-3.0% appreciation · 3.0% rent growth · sell at horizon
- IRR
- -7.7%
- Equity multiple
- 0.72×
- Total profit
- $-150,913
- Equity at exit
- $283,296
- IRR
- 1.9%
- Equity multiple
- 1.14×
- Total profit
- $71,965
- Equity at exit
- $164,277
Cash invested: $532,000 (down + closing). Projections, not guarantees.
Landlord ↔ Tenant lean methodology
- Overall (STATE)
- 28 Tenant-Leaning
- State Washington
- 28 Tenant-Leaning · D+8
- County
- — inherits STATE
- City
- — inherits STATE
ZIP-level market 98499
- Rents YoY
- 3.0%
- Active inventory
- 129
- Price-to-rent
- 76.4×
Monthly cashflow live
- Estimated rent
- $20,040 medium interval (Pro) →
- Mortgage (P&I)
- −$9,964
- Tax from tax record
- −$2,192 /mo · $26,306/yr
- Insurance
- −$792
- Flood insurance flood zone
- −$427 /mo · $5,118/yr
- HOA
- −$0
- Vacancy / Maint / Mgmt
- −$4,208
- Net cashflow
- $2,457
Break-even live
14-unit breakdown (identical units grouped — click to expand)
| Units | Beds | Baths | Est. rent |
|---|---|---|---|
| 1× unit | 4 | 3 | $2,071 |
| 1× unit | 3 | 1 | $1,887 |
| 3× units | 2 | 1 | $4,416 |
| #3 | 2 | 1 | $1,472 |
| #4 | 2 | 1 | $1,472 |
| #5 | 2 | 1 | $1,472 |
| 9× units | 1 | 1 | $11,664 |
| #6 | 1 | 1 | $1,296 |
| #7 | 1 | 1 | $1,296 |
| #8 | 1 | 1 | $1,296 |
| #9 | 1 | 1 | $1,296 |
| #10 | 1 | 1 | $1,296 |
| #11 | 1 | 1 | $1,296 |
| #12 | 1 | 1 | $1,296 |
| #13 | 1 | 1 | $1,296 |
| #14 | 1 | 1 | $1,296 |
| Total (14 units) | $20,040 | ||
UW: 25.0% down · 7.5% · 30yr · 1.5% tax · 5.0% vac · 8.0% maint · 8.0% mgmt
Financing live
Cash to close
- Down payment
- $475,000
- Closing costs
- $57,000
- Reserves months
- —
- Total cash needed
- —
Loan-product check · same deal, 3 products live
Conventional
25% down · 7.5% · 30yr
- Down + closing
- —
- Monthly P&I
- —
- Monthly cashflow
- —
- DSCR
- —
- Eligible?
- —
Personal DTI + credit; lowest rate.
DSCR
20% down · 8.5% · 30yr
- Down + closing
- —
- Monthly P&I
- —
- Monthly cashflow
- —
- DSCR
- —
- Eligible?
- —
No personal income docs; deal must DSCR.
Hard money
10% down · 12.0% · 12mo
- Down + closing
- —
- Monthly P&I
- —
- Monthly cashflow
- —
- DSCR
- —
- Eligible?
- —
Short-term bridge; refi at stabilization.
Listing history 31 events
-
2026-06-18days on market $1,900,000 Active 23 DOM
-
2026-06-17days on market $1,900,000 Active 22 DOM
-
2026-06-16days on market $1,900,000 Active 21 DOM
-
2026-06-15days on market $1,900,000 Active 20 DOM
-
2026-06-13days on market $1,900,000 Active 18 DOM
-
2026-06-09days on market $1,900,000 Active 14 DOM
-
2026-06-08days on market $1,900,000 Active 13 DOM
-
2026-06-07days on market $1,900,000 Active 12 DOM
-
2026-06-04days on market $1,900,000 Active 9 DOM
-
2026-06-03days on market $1,900,000 Active 8 DOM
-
2026-06-02days on market $1,900,000 Active 7 DOM
-
2026-06-01days on market $1,900,000 Active 6 DOM
-
2026-05-31days on market $1,900,000 Active 5 DOM
-
2026-05-26$1,900,000 Active
-
2024-04-10historical $970
-
2024-03-13$970
-
2024-01-12historical $1,795
-
2024-01-12historical $1,795
-
2024-01-11$1,795
-
2024-01-11$1,795
-
2024-01-02historical $1,295
-
2024-01-02historical $1,295
-
2024-01-02$1,295
-
2024-01-02$1,295
-
2023-12-29historical $1,295
-
2023-12-29historical $1,295
-
2023-12-23$1,295
-
2023-12-23$1,820
-
2023-12-01historical $1,820
-
2023-11-17$1,820
-
2005-03-01soldstatus $407,500
ⓘ Source: listings_history table (triggers on properties + properties_extension) + one-shot
backfill from property_details.listing_events for pre-trigger history.
Tax reassessment forecast WA · Resets to sale price
- Current annual tax
- $26,306 · $2,192/mo
- Projected year-2 tax
- $26,306 · $2,192/mo
- Expected delta
- $0/yr ($0/mo · 0.0%)
ⓘ Screening estimate from a state-policy table — verify with the county assessor before closing.
Climate risk First Street
- Flood 9/10 Extreme FEMA zone AE · 99% chance over 30 yrs
- Wildfire 1/10 Low
- Heat 3/10 Moderate 7 d/yr ≥87°F today · 14 d/yr by 30 yrs out
- Wind 1/10 Low
- Air quality 6/10 Major 9 unhealthy d/yr today · 9 by 30 yrs out
Nearby sold comps map
Loading sold comps map…
Walkable amenities ~0.75 mi
Loading nearby amenities…
Taxation est. · year 1
- Rental income
- $240,480
- − Mortgage interest
- −$106,430
- − Property taxes
- −$26,306
- − Insurance
- −$14,618
- − Repairs & maintenance
- −$19,238
- − Management
- −$19,238
- − Depreciation
- −$55,273
- Taxable loss
- −$623
- Est. tax savings @ 24.0%
- +$150
- After-tax cash flow
- $29,639/yr
For passive investors: Depreciation is non-cash, so a rental often shows a tax loss while cash-flowing — sheltering income. Rental losses are passive: they offset passive income freely, and up to $25,000/yr can offset ordinary (W-2) income if you actively participate and your MAGI is under $100k (phasing out to $0 by $150k); unused losses carry forward. On sale, claimed depreciation is recaptured at up to 25%, and gains may owe capital-gains tax (a 1031 exchange can defer both). Figures are a year-1 estimate at your 24.0% rate — not tax advice; consult a CPA.
Schools (NCES district)
- District
- Clover Park School District
- NCES district ID
- 5301410
- Math proficiency
- 39% ▼ -2.00%
- Reading proficiency
- 51% ▲ 2.00%
- Median HH income
- $42,344
- Composite
- 40.11/100
- National rank
- #7858
- State rank
- #190 of 291 in WA
Livability — Lakewood
- Score
- 74/100
- State rank
- #182
- US rank
- #4754
Category grades
Schools grade is shown separately in the Schools card above.
Census & demographics
- Census place
- Lakewood, WA
- County
- Pierce County · 788,257 people
- City population
- 61,673
- Metro
- Seattle-Tacoma-Bellevue, WA
- Population (ZIP)
- 32,464
- Household income
- $67,292
- Rent vs Own
- Severe rent burden
- 2313.0
Population outlook (Pierce County) Hauer SSP2
- Today (2025)
- 956,648 people
- By 2030
- 1,010,862 · +5.7%
- By 2040
- 1,113,170 · +16.4%
- By 2050
- 1,206,524 · +26.1%
- By 2075
- 1,436,425 · +50.2%
- By 2100
- 1,563,654 · +63.5%
Race, ethnicity, and origin ACS 2023
- Neighborhood character
- Highly diverse neighborhood (Simpson 0.76)
- Race & ethnicity
- White 39% Hispanic / Latino 25% Two or more races 17% Black 15% Asian 8% Pacific Islander 6%
- Hispanic origin (detail)
- Mexican 17% Puerto Rican 2% Cuban 1%
- Common ancestry
- Portuguese 3% Slovak 2% Lithuanian 2%
- Foreign-born
- 18% · Canada, South Korea, Vietnam
- Languages at home
- 74% English-only · Spanish 16% Korean 3% Tagalog/Filipino 2%
Political lean MEDSL · Pierce
- 2024 margin
- D (+10.8) · D 53.9% · R 43.1% · Other 3.0%
- 2008→2024 swing
- -1.4pp toward R · 2008: 12.2pp · 2024: 10.8pp
- All cycles
- 2024: D+10.8 2020: D+11.2 2016: D+7.5 2012: D+11.0 2008: D+12.2
Not yet ingested
- Civics
- —
Market trends
- HPI YoY
- ▼ -536.54%
- Current HPI
- 288.2797
- Rent YoY
- ▲ 3.00%
- Metro
- Seattle-Tacoma-Bellevue, WA
- State GDP YoY
- ▲ 4.65%
- F500 in state
- 22
Industry mix (Fortune 500 HQ in WA)
| Industry | F500 HQs | Revenue |
|---|---|---|
| Retail | 2 | $269B |
|
||
| Technology / Retail | 1 | $638B |
|
||
| Technology | 1 | $245B |
|
||
| Telecommunications | 1 | $38B |
|
||
| Food / Beverage | 1 | $36B |
|
||
| Automotive / Trucks | 1 | $34B |
|
||
Price history
+366.3% since first listed18 events — show timeline
- 2026-05-26 Listed $1,900,000 NWMLS as Distributed by MLS Grid
- 2024-04-10 Rental Removed $970 APPFOLIO
- 2024-03-13 Listed for Rent $970 APPFOLIO
- 2024-01-12 Rental Removed $1,795 APPFOLIO
- 2024-01-12 Rental Removed $1,795 APPFOLIO
- 2024-01-11 Listed for Rent $1,795 APPFOLIO
- 2024-01-11 Listed for Rent $1,795 APPFOLIO
- 2024-01-02 Rental Removed $1,295 APPFOLIO
- 2024-01-02 Rental Removed $1,295 APPFOLIO
- 2024-01-02 Listed for Rent $1,295 APPFOLIO
- 2024-01-02 Listed for Rent $1,295 APPFOLIO
- 2023-12-29 Rental Removed $1,295 APPFOLIO
- 2023-12-29 Rental Removed $1,295 APPFOLIO
- 2023-12-23 Listed for Rent $1,295 APPFOLIO
- 2023-12-23 Listed for Rent $1,820 APPFOLIO
- 2023-12-01 Rental Removed $1,820 APPFOLIO
- 2023-11-17 Listed for Rent $1,820 APPFOLIO
- 2005-03-01 Sold (Public Records) $407,500 Public Records
Property tax history
+8.3%/yrLatest (2026): $26,306 · -2.1% YoY. Source: county tax records.
Cash-flow waterfall
monthlySold comps — $/sqft
last 12 mo · ≤1 miLoading sold comps…