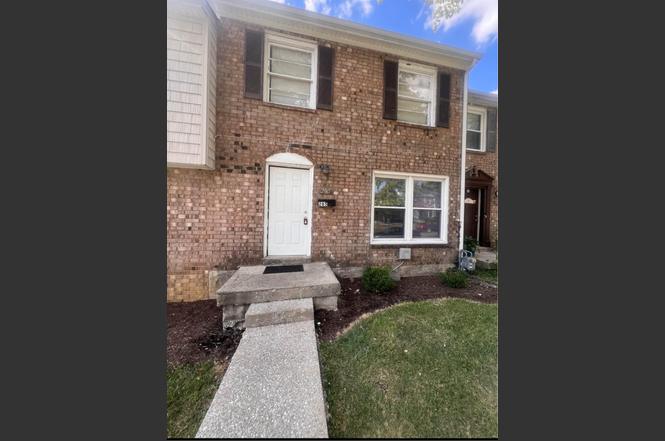
285 Osage Ct
Lexington-Fayette, KY 40509
$134,900B
3 bd · 1.5 ba ·
1,080 sqft ·
Built 1971
· Townhouse
· Active
· 225 DOM
Cashflow @ list (25.0% down · 7.5%)
Estimated rent
$1,702/mo
Mortgage (P&I)
−$707
Tax + insurance
−$97
HOA
−$92
Vac / Maint / Mgmt
−$357
Net cashflow
$447/mo
Annual
$5,369/yr
Cap rate
10.27%
Cash-on-cash
14.21%
DSCR
1.63
1% rule
1.26%
Cash to close
$37,772
Investor read
- This is a 3-bed/1.5-bath townhouse listed at $135k.
- At list price, monthly cash flow is $447 ($5k/yr) — positive.
- The deal already cash-flows at list — no discount required.
- Meets the 1% rule at list price ($2k rent vs $135k).
- It's been on market 225 days — a 12% lower offer ($119k) is reasonable based on typical stale-listing flexibility.
- Recommended offer: $119k (12.0% below list) — sets the bar for market timing.
- Local home prices are declining (-3.0%/yr); year-one equity from $933 of loan paydown is wiped out by about $4k of value loss. Plan a longer hold.
- Location reads: area grade B — affects rentability + tenant quality, not the cash-flow math above.
- Fayette County (urban): math 35% / reading 45% proficiency, ranked #27 of 165 in KY (top 16%) — families likely to look elsewhere, expect single-tenant / working-renter base with shorter leases.
- Zoned schools: Madeline M Breckinridge Elem School (math 27% / reading 37%, grade F, #348 of 676 statewide, top 55%, 509 students, 78% FRL); Crawford Middle School (math 15% / reading 31%, grade F, #197 of 217 statewide, top 92%, 751 students, 68% FRL); Henry Clay High School (math 43% / reading 49%, grade D-, #20 of 254 statewide, top 8%, 2,031 students, 47% FRL) — zoned schools average 64% FRL vs 44% district-wide (20 pts higher); higher-poverty schools than district average — tighter screening recommended.
- Market conditions: Rents rising (+2.2%/yr); 279 active listings in the ZIP; 40 comparable units currently listed for rent nearby; rentals at typical pace (median 22d on market — plan ~3-4 weeks tenant-placement turnaround); solid renter incomes; 1,036 units permitted in Fayette County in 2024 (542 in 5+ unit buildings).
- Fayette County population projected at +35% by 2050 — long-run rental-demand tailwind backs the buy-and-hold thesis.
- 4 sale attempts since 3y ago; this cycle's ask has dropped $7k (5%) from the opening price — seller is motivated, your offer sets the floor, not the list.
- At projected returns (-3.0% appreciation + 2.2% rent growth), your $38k cash investment doubles in ~9 years — after that, you're playing with house money.
- Cap rate 10.3% vs local median 3.8% in Lexington-Fayette — top-decile yield for the area; either an underpriced asset or a hidden risk that comps aren't pricing in. Stress-test before assuming the spread holds.
Questions for listing agent
- It's been on market 225 days. Have you received any prior offers? Is the seller open to a 12% concession, seller financing, or rate buy-down credit?
- Built in 1971 — when were the roof, HVAC, electrical panel, plumbing, and water heater last replaced?
- What does the HOA fee cover, when was the last increase, and are there any pending special assessments or reserve-fund shortfalls?
- Why hasn't it sold? Are there any deal-killer items the seller is aware of (foundation, flood, title, zoning, code violations)?
- Is there a deadline driving the sale (1031 exchange, divorce, estate, relocation)? That informs how much negotiation room exists.
- What's the average days-on-market for RENTAL listings here right now (not sales)? A rising rental-DOM trend means longer vacancies and softer asking-rent achievability than the comps imply.
- What's the recent tenant-quality profile in this submarket — average credit score on applications, eviction rate, late-payment / NSF rate, and stable-employment percentage? A property-management company in the area should have these aggregated.
- How much new for-sale + rental construction is in the pipeline within 1–3 miles? Heavy new supply typically softens prices + rents 12–24 months out; constrained supply supports both.
CashFlowRE · CFR-GDD698BT72KQ6W
· Data 3 days ago
cashflowre.app · 2026-05-29