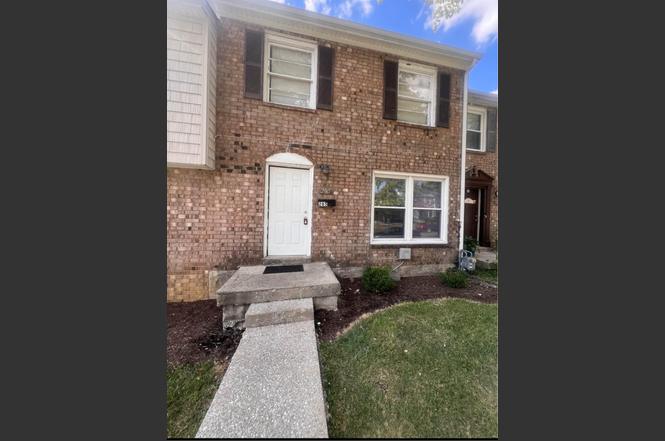
285 Osage Ct · Lexington-Fayette, KY
Flood risk 1/10 · Minimal
- FEMA flood zone
- X (unshaded)
- Chance of flooding over 30 yrs
- 0.0%
- Est. flood insurance / yr
- $507 – $1,088
Fire risk 1/10 · Minimal
- Est. fire insurance / yr
- $839 – $1,559
Heat risk 4/10 · Minor
- Hot days now (above 101°F)
- 7 days/yr
- Hot days in 30 yrs
- 19 days/yr
Wind risk 2/10 · Minimal
- Chance of severe wind over 30 yrs
- 2.0%
Air-quality risk 1/10 · Minimal
- Unhealthy air days now
- 0 days/yr
- Unhealthy air days in 30 yrs
- 0 days/yr
Risk factors via First Street. Map © Google.
Why this score? — see what drove the B grade
The composite is a weighted blend of 9 inputs, each scored 0–100. Each bar is that input's sub-score; the figure is the points it added to the 100-point composite (weight × sub-score).
- Cash flow +28.7/30.0
- ARV discount +15.0/15.0
- DSCR +10.0/10.0
- 1% rule +7.6/10.0
- Schools +3.4/10.0
- Rent growth +3.1/5.0
- Livability +2.5/5.0
- Condition / age +2.5/5.0
- Appreciation +0.0/10.0
$134,900
🖨 Deal sheet (PDF) 📄 Offer letter ✓ Due diligence
Listing remarks MLS
Nicely updated townhome that could be a great fit for a first time homeowner or an investor. Solid surface flooring throughout with bamboo flooring in most of the living areas and bedrooms. Ceramic tile in the kitchen and bathrooms including a walk-in ceramic tile shower upstairs. Fenced back patio area with a gate that opens to community green space area with a playground and basketball court.
Key facts
- Wood flooring
- Fenced patio
- Basketball court
Tags
Property features AI
Finance
- HOA & community: Has association with monthly fee
Exterior
- Parking: Off-street parking; Other parking
- Utilities: Public water; Public sewer; Electricity available; Sewer connected; Water available
- Home design: House; Two levels
- Construction: Brick veneer and vinyl siding; Block foundation; Dimensional style roof
- Exterior features: Wood fencing; Neighborhood view
Interior
- Kitchen: Dishwasher; Microwave; Refrigerator; Range
- Bedrooms: 3 total rooms (includes bedrooms and living areas)
- Flooring: Vinyl flooring
- Bathrooms: 1 full bathroom; 1 half bathroom
- Heating & cooling: Electric heating; Heat pump; Central air; Electric cooling
- Interior features: Ceiling fan(s)
- Laundry & utility: Washer hookup; Electric dryer hookup
Neighborhood map
What this means for you Summary
Snapshot
- This is a 3-bed/1.5-bath townhouse listed at $135k.
Deal economics
- At list price, monthly cash flow is $447 ($5k/yr) — positive.
- The deal already cash-flows at list — no discount required.
- Meets the 1% rule at list price ($2k rent vs $135k).
- Recommended offer: $119k (12.0% below list) — sets the bar for market timing.
- Cap rate 10.3% vs local median 3.8% in Lexington-Fayette — top-decile yield for the area; either an underpriced asset or a hidden risk that comps aren't pricing in. Stress-test before assuming the spread holds.
Location & tenants
- Location reads: area grade B — affects rentability + tenant quality, not the cash-flow math above.
- Fayette County (urban): math 35% / reading 45% proficiency, ranked #27 of 165 in KY (top 16%) — families likely to look elsewhere, expect single-tenant / working-renter base with shorter leases.
- Zoned schools: Madeline M Breckinridge Elem School (math 27% / reading 37%, grade F, #348 of 676 statewide, top 55%, 509 students, 78% FRL); Crawford Middle School (math 15% / reading 31%, grade F, #197 of 217 statewide, top 92%, 751 students, 68% FRL); Henry Clay High School (math 43% / reading 49%, grade D-, #20 of 254 statewide, top 8%, 2,031 students, 47% FRL) — zoned schools average 64% FRL vs 44% district-wide (20 pts higher); higher-poverty schools than district average — tighter screening recommended.
- Market conditions: Rents rising (+2.2%/yr); 279 active listings in the ZIP; 40 comparable units currently listed for rent nearby; rentals at typical pace (median 22d on market — plan ~3-4 weeks tenant-placement turnaround); solid renter incomes; 1,036 units permitted in Fayette County in 2024 (542 in 5+ unit buildings).
Forward outlook
- Local home prices are declining (-3.0%/yr); year-one equity from $933 of loan paydown is wiped out by about $4k of value loss. Plan a longer hold.
- Fayette County population projected at +35% by 2050 — long-run rental-demand tailwind backs the buy-and-hold thesis.
- At projected returns (-3.0% appreciation + 2.2% rent growth), your $38k cash investment doubles in ~9 years — after that, you're playing with house money.
Negotiation context
- It's been on market 225 days — a 12% lower offer ($119k) is reasonable based on typical stale-listing flexibility.
- 4 sale attempts since 3y ago; this cycle's ask has dropped $7k (5%) from the opening price — seller is motivated, your offer sets the floor, not the list.
Questions for the listing agent
- It's been on market 225 days. Have you received any prior offers? Is the seller open to a 12% concession, seller financing, or rate buy-down credit?
- Built in 1971 — when were the roof, HVAC, electrical panel, plumbing, and water heater last replaced?
- What does the HOA fee cover, when was the last increase, and are there any pending special assessments or reserve-fund shortfalls?
- Why hasn't it sold? Are there any deal-killer items the seller is aware of (foundation, flood, title, zoning, code violations)?
- Is there a deadline driving the sale (1031 exchange, divorce, estate, relocation)? That informs how much negotiation room exists.
- What's the average days-on-market for RENTAL listings here right now (not sales)? A rising rental-DOM trend means longer vacancies and softer asking-rent achievability than the comps imply.
- What's the recent tenant-quality profile in this submarket — average credit score on applications, eviction rate, late-payment / NSF rate, and stable-employment percentage? A property-management company in the area should have these aggregated.
- How much new for-sale + rental construction is in the pipeline within 1–3 miles? Heavy new supply typically softens prices + rents 12–24 months out; constrained supply supports both.
Investment metrics
- 1% rule
- 1.26% ✓
- Cap rate
- 10.27%
- Cash-on-cash
- 14.21%
- DSCR
- 1.63
- GRM
- 6.6
CMA / ARV
- ARV (on-the-fly)
- $205,200
- Comps found
- 12
Show comp detail 12 sales within ~0.75 mi
| Address | Dist | Beds/Ba | Sqft | Sold | Price | $/sf | Match |
|---|---|---|---|---|---|---|---|
| 277 Osage Ct | 0.02mi | 3/1.5 | 1,080 (0%) | 2mo | $115,000 | $106 | 98 |
| 292 Osage Ct | 0.03mi | 3/1.5 | 1,080 (0%) | 5mo | $149,900 | $139 | 95 |
| 2804 Hanna Pl | 0.40mi | 2/2.5 (-1) | 1,088 (+1%) | 2mo | $150,000 | $138 | 70 |
| 209 Old Todds Rd #2109 | 0.38mi | 2/1.5 (-1) | 1,008 (-7%) | 4mo | $197,500 | $196 | 62 |
| 209 Old Todds Rd #11101 | 0.38mi | 2/1.5 (-1) | 1,064 (-2%) | 16mo | $210,000 | $197 | 62 |
| 3042 Bonanza Dr | 0.62mi | 2/2.0 (-1) | 1,100 (+2%) | 1mo | $190,000 | $173 | 60 |
| 943 Mcclanahan Ln Ln | 0.32mi | 2/2.0 (-1) | 1,156 (+7%) | 11mo | $225,000 | $195 | 57 |
| 2925 Rio Dosa Dr | 0.66mi | 2/2.0 (-1) | 1,071 (-1%) | 7mo | $203,000 | $190 | 55 |
| 2931 Rio Dosa Dr | 0.67mi | 2/2.0 (-1) | 1,125 (+4%) | 3mo | $228,500 | $203 | 52 |
| 309 Santa Fe Ct | 0.70mi | 2/2.0 (-1) | 1,082 (+0%) | 11mo | $175,000 | $162 | 50 |
| 2927 Rio Dosa Dr | 0.67mi | 2/2.0 (-1) | 1,071 (-1%) | 14mo | $188,400 | $176 | 49 |
| 307 Santa Fe Ct | 0.71mi | 2/2.0 (-1) | 1,140 (+6%) | 5mo | $225,000 | $197 | 47 |
Match score weights: distance 35% · size 25% · config 20% · recency 20%. Top-matched comps best support the ARV.
Projected returns pro-forma
-3.0% appreciation · 2.22% rent growth · sell at horizon
- IRR
- 3.7%
- Equity multiple
- 1.14×
- Total profit
- $5,316
- Equity at exit
- $20,114
- IRR
- 12.5%
- Equity multiple
- 1.95×
- Total profit
- $35,987
- Equity at exit
- $11,664
Cash invested: $37,772 (down + closing). Projections, not guarantees.
Landlord ↔ Tenant lean methodology
- Overall (STATE)
- 83 Strongly Landlord-Friendly
- State Kentucky
- 83 Strongly Landlord-Friendly · R+16
- County
- — inherits STATE
- City
- — inherits STATE
ZIP-level market 40509
- Home prices YoY
- -20.6%
- Rents YoY
- 2.2%
- Active inventory
- 279
- Price-to-rent
- 6.6×
Monthly cashflow live
- Estimated rent
- $1,702 high interval (Pro) →
- Mortgage (P&I)
- −$707
- Tax from tax record
- −$41 /mo · $495/yr
- Insurance
- −$56
- HOA
- −$92
- Vacancy / Maint / Mgmt
- −$357
- Net cashflow
- $447
Break-even live
Sensitivity live
| Price | -10% $524 | -5% $486 | +0% $447 | +5% $409 | +10% $371 |
|---|---|---|---|---|---|
| Rent | -10% $313 | -5% $380 | +0% $447 | +5% $515 | +10% $582 |
| Rate | -1.0pp $515 | -0.5pp $482 | base $447 | +0.5pp $412 | +1.0pp $377 |
UW: 25.0% down · 7.5% · 30yr · 1.5% tax · 5.0% vac · 8.0% maint · 8.0% mgmt
Financing live
Cash to close
- Down payment
- $33,725
- Closing costs
- $4,047
- Reserves months
- —
- Total cash needed
- —
Loan-product check · same deal, 3 products live
Conventional
25% down · 7.5% · 30yr
- Down + closing
- —
- Monthly P&I
- —
- Monthly cashflow
- —
- DSCR
- —
- Eligible?
- —
Personal DTI + credit; lowest rate.
DSCR
20% down · 8.5% · 30yr
- Down + closing
- —
- Monthly P&I
- —
- Monthly cashflow
- —
- DSCR
- —
- Eligible?
- —
No personal income docs; deal must DSCR.
Hard money
10% down · 12.0% · 12mo
- Down + closing
- —
- Monthly P&I
- —
- Monthly cashflow
- —
- DSCR
- —
- Eligible?
- —
Short-term bridge; refi at stabilization.
Rent comps 40 comps
| Address | Beds | Baths | Sqft | Rent | $/sqft | DOM | Units | Dist |
|---|---|---|---|---|---|---|---|---|
| 262 Osage Ct Unit 1 Lexington, KY | 3.0 | 1.5 | 1080 | $1,475 | $1.37 | 24d | 1 | 0.07mi |
| 179 Hedgewood Ct Unit 1 Lexington, KY | 3.0 | 1.5 | 1080 | $1,375 | $1.27 | 24d | 1 | 0.13mi |
| 308 Larkwood Dr Unit Z1 Lexington, KY | 4.0 | 2.0 | 1361 | $1,849 | $1.36 | 14d | 1 | 0.15mi |
| 2400 Woodhill Dr Lexington, KY | 3.0 | 1.0 | 1000 | $1,250 | $1.25 | 24d | 1 | 0.16mi |
| 2409 Timberhill Ct Unit 4 Lexington, KY | 2.0 | 1.5 | 990 | $1,150 | $1.16 | 24d | 1 | 0.22mi |
| 200 Alsab Ct Lexington, KY | 2.0–3.0 | 1.5 | 940 | $1,445 | $1.54 | 24d | 10 | 0.23mi |
| 300 Quinton Ct Lexington, KY | 1.0–3.0 | 1.0–2.0 | 927 | $1,557 | $1.68 | 14d | 38 | 0.35mi |
| 175 N Mount Tabor Rd Lexington, KY | 1.0–2.0 | 1.0–2.0 | 847 | $1,362 | $1.61 | 14d | 9 | 0.51mi |
| 649 Hugging Bear Dr Lexington, KY | 3.0 | 2.0 | 1253 | $1,750 | $1.40 | 22d | 1 | 0.61mi |
| 2716 Chelsea Woods Ct Lexington, KY | 2.0 | 1.0 | 861 | $1,400 | $1.63 | 14d | 1 | 0.61mi |
| 2720 Chelsea Woods Ct Lexington, KY | 3.0 | 2.0 | 1018 | $1,595 | $1.57 | 24d | 1 | 0.62mi |
| 2116 Saint Teresa Dr Lexington, KY | 3.0 | 1.0 | 999 | $1,900 | $1.90 | 24d | 1 | 0.62mi |
| 2334 Lake Park Rd Lexington, KY | 1.0–2.0 | 1.0–2.0 | 837 | $1,448 | $1.73 | 14d | 7 | 0.67mi |
| 175 N Locust Hill Dr Lexington, KY | 1.0–2.0 | 1.0–2.0 | 700 | $1,170 | $1.67 | 14d | 11 | 0.74mi |
| 2360 Liberty Rd Lexington, KY | 3.0 | 2.0 | 1415 | $1,895 | $1.34 | 14d | 1 | 0.75mi |
| 2052 Saint Christopher Dr Lexington, KY | 4.0 | 2.0 | 1008 | $2,050 | $2.03 | 14d | 1 | 0.76mi |
| 2414 Lake Park Rd Lexington, KY | 1.0–3.0 | 1.0–2.0 | 1123 | $2,200 | $1.96 | 22d | 3 | 0.79mi |
| 2414 Lake Park Rd Lexington, KY | 2.0–3.0 | 2.0 | 1352 | $2,200 | $1.63 | 14d | 2 | 0.79mi |
| 2041 Saint Michael Dr Unit 5 Lexington, KY | 2.0 | 1.0 | 900 | $1,250 | $1.39 | 24d | 1 | 0.79mi |
| 2021 Saint Christopher Dr Lexington, KY | 3.0 | 1.0 | 1025 | $2,100 | $2.05 | 14d | 1 | 0.84mi |
| 2240 Kenwood Dr Lexington, KY | 3.0 | 2.0 | 1264 | $1,795 | $1.42 | 14d | 1 | 0.87mi |
| 251 Chippendale Cir Lexington, KY | 1.0–2.0 | 1.0–2.0 | 842 | $1,450 | $1.72 | 14d | 12 | 0.92mi |
| 151 S Locust Hill Dr Lexington, KY | 1.0–2.0 | 1.0–2.0 | 761 | $1,348 | $1.77 | 14d | 19 | 0.93mi |
| 2561 Mackenzie Ln Lexington, KY | 2.0 | 2.5 | 1250 | $1,395 | $1.12 | 14d | 1 | 0.96mi |
| 100 Lakeshore Dr Lexington, KY | 1.0–3.0 | 1.0–2.0 | 925 | $1,560 | $1.69 | 14d | 14 | 0.97mi |
| 2548 Danielle Ln Lexington, KY | 2.0 | 2.0 | 1050 | $1,200 | $1.14 | 14d | 1 | 1.00mi |
| 2543 Danielle Ln Lexington, KY | 3.0 | 2.0 | 1400 | $1,600 | $1.14 | 24d | 1 | 1.02mi |
| 2082 Fairmont Ct Lexington, KY | 2.0 | 1.5 | 900 | $925 | $1.03 | 24d | 1 | 1.02mi |
| 201 Lakeshore Dr Unit 9 Lexington, KY | 3.0 | 2.0 | 1185 | $1,095 | $0.92 | 22d | 1 | 1.11mi |
| 2035 Altamont Ct Unit A09 Lexington, KY | 3.0 | 2.0 | 1150 | $1,450 | $1.26 | 14d | 1 | 1.11mi |
| 209 Lakeshore Dr Unit 9 Lexington, KY | 3.0 | 2.0 | 1050 | $1,145 | $1.09 | 22d | 1 | 1.12mi |
| 531 Laketower Dr Unit 502 Lexington, KY | 2.0 | 2.0 | 1457 | $5,499 | $3.77 | 24d | 1 | 1.12mi |
| 531 Laketower Dr Unit 506 Lexington, KY | 2.0 | 2.0 | 1326 | $4,699 | $3.54 | 24d | 1 | 1.12mi |
| 531 Laketower Dr Unit 418 Lexington, KY | 2.0 | 2.0 | 1175 | $3,799 | $3.23 | 24d | 1 | 1.12mi |
| 531 Laketower Dr Unit 308 Lexington, KY | 2.0 | 2.0 | 1326 | $3,699 | $2.79 | 24d | 1 | 1.12mi |
| 531 Laketower Dr Unit 522 Lexington, KY | 2.0 | 2.0 | 1367 | $5,699 | $4.17 | 24d | 1 | 1.12mi |
| 531 Laketower Dr Unit 314 Lexington, KY | 2.0 | 2.0 | 1147 | $2,999 | $2.61 | 14d | 1 | 1.12mi |
| 531 Laketower Dr Unit 316 Lexington, KY | 2.0 | 2.0 | 1175 | $3,199 | $2.72 | 24d | 1 | 1.12mi |
| 531 Laketower Dr Unit 414 Lexington, KY | 2.0 | 2.0 | 1147 | $3,499 | $3.05 | 24d | 1 | 1.12mi |
| 531 Laketower Dr Unit 518 Lexington, KY | 2.0 | 2.0 | 1175 | $4,299 | $3.66 | 24d | 1 | 1.12mi |
HOA detail
- Monthly dues
- $92 · $1,104/yr
Listing history 32 events
-
2026-06-18days on market $134,900 Active 225 DOM
-
2026-06-17days on market $134,900 Active 224 DOM
-
2026-06-16days on market $134,900 Active 223 DOM
-
2026-06-15days on market $134,900 Active 222 DOM
-
2026-06-14days on market $134,900 Active 220 DOM
-
2026-06-13days on market $134,900 Active 219 DOM
-
2026-06-10days on market $134,900 Active 217 DOM
-
2026-06-09days on market $134,900 Active 216 DOM
-
2026-06-08days on market $134,900 Active 215 DOM
-
2026-06-07days on market $134,900 Active 214 DOM
-
2026-06-05days on market $134,900 Active 211 DOM
-
2026-06-03days on market $134,900 Active 210 DOM
-
2026-06-02days on market $134,900 Active 209 DOM
-
2026-06-01days on market $134,900 Active 208 DOM
-
2026-05-31days on market $134,900 Active 207 DOM
-
2026-05-04price $134,900
-
2026-03-16price $137,900
-
2026-01-20price $139,900
-
2025-11-04$142,000 Active
-
2025-10-27historical
-
2025-10-20status Active
-
2025-10-17historical
-
2025-10-12price $142,000
-
2025-09-23price $147,000
-
2025-04-17$152,000 Active
-
2023-07-17soldstatus $142,000
-
2023-07-10soldstatus $142,000 Closed 397-char remark
Show marketing remark (397 chars)
Nicely updated townhome that could be a great fit for a first time homeowner or an investor. Solid surface flooring throughout with bamboo flooring in most of the living areas and bedrooms. Ceramic tile in the kitchen and bathrooms including a walk-in ceramic tile shower upstairs. Fenced back patio area with a gate that opens to community green space area with a playground and basketball court.
-
2023-05-25status Pending 397-char remark
Show marketing remark (397 chars)
Nicely updated townhome that could be a great fit for a first time homeowner or an investor. Solid surface flooring throughout with bamboo flooring in most of the living areas and bedrooms. Ceramic tile in the kitchen and bathrooms including a walk-in ceramic tile shower upstairs. Fenced back patio area with a gate that opens to community green space area with a playground and basketball court.
-
2023-03-12$147,500 Active 397-char remark
Show marketing remark (397 chars)
Nicely updated townhome that could be a great fit for a first time homeowner or an investor. Solid surface flooring throughout with bamboo flooring in most of the living areas and bedrooms. Ceramic tile in the kitchen and bathrooms including a walk-in ceramic tile shower upstairs. Fenced back patio area with a gate that opens to community green space area with a playground and basketball court.
-
2019-10-28soldstatus $1,605,905
-
2018-07-03soldstatus $3,703,040
-
2017-01-20soldstatus $270,000
ⓘ Source: listings_history table (triggers on properties + properties_extension) + one-shot
backfill from property_details.listing_events for pre-trigger history.
Tax reassessment forecast KY · Resets to sale price
- Current annual tax
- $495 · $41/mo
- Projected year-2 tax
- $1,160 · $97/mo
- Expected delta
- +$665/yr (+$55/mo · 134.3%)
ⓘ Screening estimate from a state-policy table — verify with the county assessor before closing.
Climate risk First Street
- Flood 1/10 Low FEMA zone X (unshaded) · 0% chance over 30 yrs
- Wildfire 1/10 Low
- Heat 4/10 Moderate 7 d/yr ≥101°F today · 19 d/yr by 30 yrs out
- Wind 2/10 Low 2% chance of damaging wind over 30 yrs
- Air quality 1/10 Low 0 unhealthy d/yr today · 0 by 30 yrs out
Nearby sold comps map
Loading sold comps map…
Walkable amenities ~0.75 mi
Loading nearby amenities…
Taxation est. · year 1
- Rental income
- $20,420
- − Mortgage interest
- −$7,556
- − Property taxes
- −$495
- − Insurance
- −$674
- − Repairs & maintenance
- −$1,634
- − Management
- −$1,634
- − HOA
- −$1,104
- − Depreciation
- −$3,924
- Taxable income
- $3,398
- Est. tax owed @ 24.0%
- −$816
- After-tax cash flow
- $4,554/yr
For passive investors: Depreciation is non-cash, so a rental often shows a tax loss while cash-flowing — sheltering income. Rental losses are passive: they offset passive income freely, and up to $25,000/yr can offset ordinary (W-2) income if you actively participate and your MAGI is under $100k (phasing out to $0 by $150k); unused losses carry forward. On sale, claimed depreciation is recaptured at up to 25%, and gains may owe capital-gains tax (a 1031 exchange can defer both). Figures are a year-1 estimate at your 24.0% rate — not tax advice; consult a CPA.
Schools (NCES district)
- District
- Fayette County
- NCES district ID
- 2101860
- Math proficiency
- 35% ▼ -16.00%
- Reading proficiency
- 45% ▼ -13.00%
- Median HH income
- $49,245
- Composite
- 34.38/100
- National rank
- #5211
- State rank
- #27 of 165 in KY
Livability — Lexington-Fayette
No livability data for this city. (Only ~50 U.S. cities are tracked.)
Census & demographics
- Census place
- Lexington-Fayette, KY
- County
- Fayette County · 317,143 people
- City population
- 321,882
- Metro
- Lexington-Fayette, KY
- Population (ZIP)
- 47,036
- Household income
- $94,804
- Rent vs Own
- Severe rent burden
- 1763.0
Population outlook (Fayette County) Hauer SSP2
- Today (2025)
- 363,454 people
- By 2030
- 388,270 · +6.8%
- By 2040
- 438,688 · +20.7%
- By 2050
- 490,667 · +35.0%
- By 2075
- 625,394 · +72.1%
- By 2100
- 721,354 · +98.5%
Race, ethnicity, and origin ACS 2023
- Neighborhood character
- Predominantly White (67%)
- Race & ethnicity
- White 67% Black 14% Two or more races 8% Asian 7% Hispanic / Latino 7%
- Hispanic origin (detail)
- Mexican 4%
- Common ancestry
- Italian 2% Slovak 2% Romanian 2%
- Foreign-born
- 12% · Canada, China
- Languages at home
- 84% English-only · Spanish 6% Other Indo-European 3% Other Asian/Pacific 2%
Political lean MEDSL · Fayette
- 2024 margin
- D (+18.1) · D 58.0% · R 39.9% · Other 2.1%
- 2008→2024 swing
- +13.3pp toward D · 2008: 4.8pp · 2024: 18.1pp
- All cycles
- 2024: D+18.1 2020: D+20.8 2016: D+9.5 2012: D+1.0 2008: D+4.8
Not yet ingested
- Civics
- —
Market trends
- HPI YoY
- ▼ -58.72%
- Current HPI
- 226.8663
- Rent YoY
- ▲ 2.22%
- Metro
- Lexington-Fayette, KY
- State GDP YoY
- ▲ 1.81%
- F500 in state
- 4
Industry mix (Fortune 500 HQ in KY)
| Industry | F500 HQs | Revenue |
|---|---|---|
| Healthcare | 1 | $118B |
|
||
| Food / Beverage | 1 | $7B |
|
||
Price history
-50.0% since first listed17 events — show timeline
- 2026-05-04 Price Changed $134,900 ImagineMLS
- 2026-03-16 Price Changed $137,900 ImagineMLS
- 2026-01-20 Price Changed $139,900 ImagineMLS
- 2025-11-04 Listed $142,000 ImagineMLS
- 2025-10-27 Listing Removed — ImagineMLS
- 2025-10-20 Relisted — ImagineMLS
- 2025-10-17 Listing Removed — ImagineMLS
- 2025-10-12 Price Changed $142,000 ImagineMLS
- 2025-09-23 Price Changed $147,000 ImagineMLS
- 2025-04-17 Listed $152,000 ImagineMLS
- 2023-07-17 Sold (Public Records) $142,000 Public Records
- 2023-07-10 Sold (MLS) $142,000 ImagineMLS
- 2023-05-25 Pending — ImagineMLS
- 2023-03-12 Listed $147,500 ImagineMLS
- 2019-10-28 Sold (Public Records) $1,605,905 Public Records
- 2018-07-03 Sold (Public Records) $3,703,040 Public Records
- 2017-01-20 Sold (Public Records) $270,000 Public Records
Property tax history
+1.9%/yrLatest (2015): $495 · +1.9% YoY. Source: county tax records.
Cash-flow waterfall
monthlySold comps — $/sqft
last 12 mo · ≤1 miLoading sold comps…