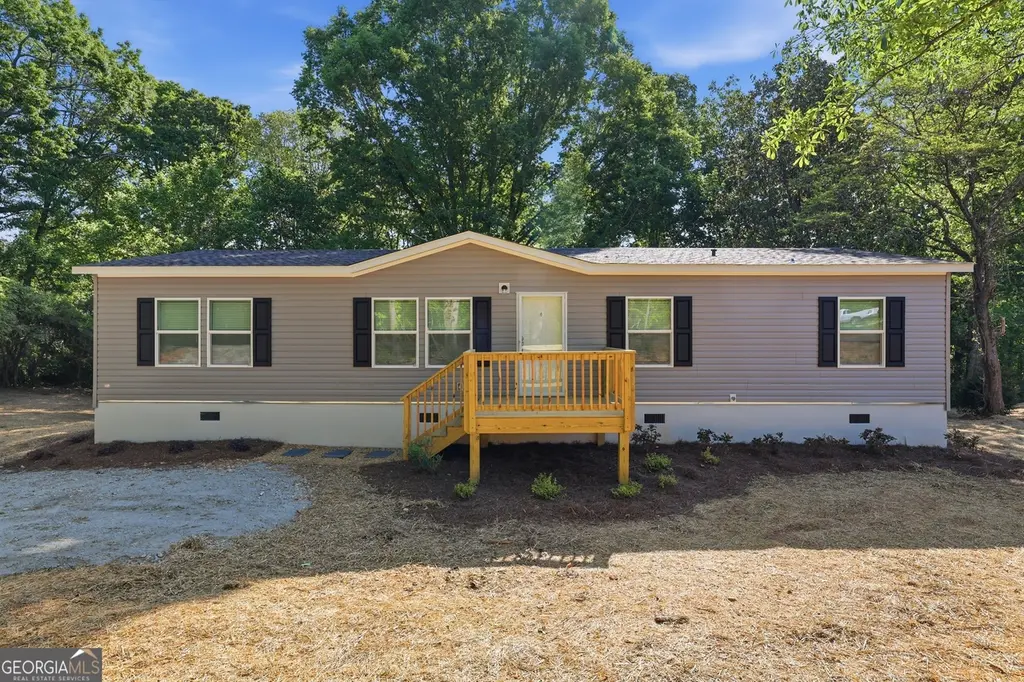
466 Cherry Cir
Baldwin, GA 30531
$254,900F
3 bd · 2.0 ba ·
1,568 sqft ·
Built 2026
· SingleFamily
· Under Contract
· 26 DOM
Cashflow @ list (25.0% down · 7.5%)
Estimated rent
$1,869/mo
Mortgage (P&I)
−$1,717
Tax + insurance
−$546
HOA
−$0
Vac / Maint / Mgmt
−$393
Net cashflow
$-786/mo
Annual
$-9,427/yr
Cap rate
3.41%
Cash-on-cash
-10.28%
DSCR
0.54
1% rule
0.57%
Cash to close
$91,662
Investor read
- This is a 3-bed/2.0-bath single-family listed at $255k.
- At list price, monthly cash flow is $-786 ($-9k/yr) — negative.
- To cash-flow at today's rent, offer at most $214k (16.2% below list).
- To meet the 1% rule (rent ≥ 1% of price), the offer needs to be $187k (26.7% below list).
- It's been on market 26 days — a 2% lower offer ($251k) is reasonable based on typical stale-listing flexibility.
- Recommended offer: $187k (26.7% below list) — sets the bar for 1% rule.
- Local home prices are declining (-3.0%/yr); year-one equity from $2k of loan paydown is wiped out by about $10k of value loss. Plan a longer hold.
- Location reads 65/100 on livability (#235 in GA) — a middle-class / working-renter tenant base. Strengths: cost of living A+, crime B+, housing B; Watch: amenities F, commute F, health & safety D-.
- Habersham County (rural): math 38% / reading 39% proficiency, ranked #53 of 174 in GA (top 30%) — families likely to look elsewhere, expect single-tenant / working-renter base with shorter leases.
- Zoned schools: Level Grove Elementary School (math 42% / reading 32%, grade F, #485 of 1,228 statewide, top 41%, 593 students, 61% FRL); South Habersham Middle School (math 35% / reading 41%, grade F, #159 of 470 statewide, top 34%, 459 students, 66% FRL); Habersham Central High School (math 8% / reading 38%, grade F, #209 of 424 statewide, top 49%, 1,525 students, 47% FRL).
- Market conditions: 86 active listings in the ZIP; 215 units permitted in Habersham County in 2024 (5 in 5+ unit buildings).
- Habersham County population projected at +8% by 2050 — modest demand growth; plan on rents tracking national, not racing it.
- Cap rate 3.4% vs local median 2.7% in Baldwin — meaningfully above typical; check what's discounted (condition, days-on-market, listing class) to confirm the premium yield is real.
Questions for listing agent
- What do current leases actually rent for vs. the listed asking? Can we see a recent rent roll and the last 12 months of T-12 income?
- Is there a deadline driving the sale (1031 exchange, divorce, estate, relocation)? That informs how much negotiation room exists.
- Schools are F-rated, which usually means shorter tenancies and higher turnover. Who's the typical renter profile here, and what's been the actual vacancy rate?
- The area grade is low — what's the realistic commute time and amenity access for the typical tenant pool here? Any planned neighborhood developments (good or bad) we should know about?
- What's the average days-on-market for RENTAL listings here right now (not sales)? A rising rental-DOM trend means longer vacancies and softer asking-rent achievability than the comps imply.
- What's the recent tenant-quality profile in this submarket — average credit score on applications, eviction rate, late-payment / NSF rate, and stable-employment percentage? A property-management company in the area should have these aggregated.
- How much new for-sale + rental construction is in the pipeline within 1–3 miles? Heavy new supply typically softens prices + rents 12–24 months out; constrained supply supports both.
CashFlowRE · CFR-GDP8YN0TCG65Q5
· Data 3 weeks ago
cashflowre.app · 2026-05-29