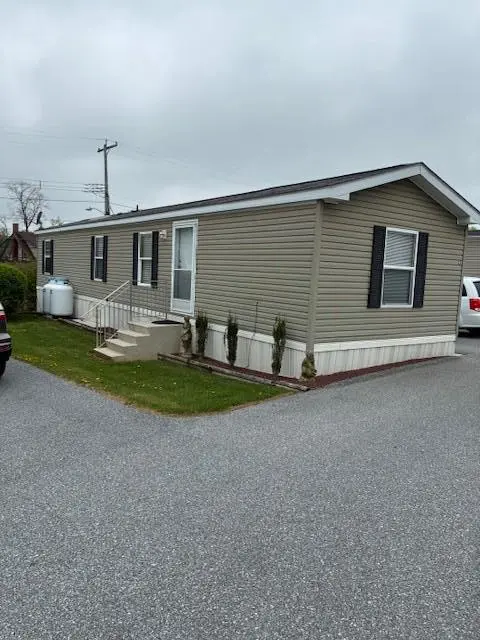
1412 SANDHILL RD 12 Sandhill Park
Sand Hill, PA 17046
$88,500C+
2 bd · 1.0 ba ·
784 sqft ·
Built 2008
· SingleFamily
· Pending
· 9 DOM
Cashflow @ list (25.0% down · 7.5%)
Estimated rent
$1,346/mo
Mortgage (P&I)
−$464
Tax + insurance
−$148
HOA
−$400
Vac / Maint / Mgmt
−$283
Net cashflow
$52/mo
Annual
$625/yr
Cap rate
7.00%
Cash-on-cash
2.52%
DSCR
1.11
1% rule
1.52%
Cash to close
$24,780
Investor read
- This is a 2-bed/1.0-bath single-family listed at $88k.
- At list price, monthly cash flow is $52 ($625/yr) — positive.
- The deal already cash-flows at list — no discount required.
- Meets the 1% rule at list price ($1k rent vs $88k).
- Only 9 days on market — expect competitive offers; lowballing is unlikely to land.
- Local home prices are declining (-3.0%/yr); year-one equity from $612 of loan paydown is wiped out by about $3k of value loss. Plan a longer hold.
- Location reads 66/100 on livability (#1,051 in PA) — a middle-class / working-renter tenant base. Strengths: crime A+, cost of living A+, housing A+; Watch: amenities F, commute F, health & safety F.
- Cornwall-Lebanon SD (suburban): math 37% / reading 56% proficiency, ranked #219 of 539 in PA (top 41%) — families likely to look elsewhere, expect single-tenant / working-renter base with shorter leases.
- Zoned schools: Ebenezer El Sch (math 30% / reading 41%, grade F, #1,040 of 1,518 statewide, top 69%, 539 students, 48% FRL); Cedar Crest Ms (math 24% / reading 59%, grade F, #234 of 512 statewide, top 47%, 1,302 students, 44% FRL); Cedar Crest Hs (math 77% / reading 34%, grade C, #93 of 437 statewide, top 22%, 1,633 students, 34% FRL) — zoned schools average 42% FRL vs 26% district-wide (15 pts higher); higher-poverty schools than district average — tighter screening recommended.
- Watch-outs: HOA is 30% of rent.
- Market conditions: Rents rising fast (+7.4%/yr); 121 active listings in the ZIP; 315 units permitted in Lebanon County in 2024 (36 in 5+ unit buildings).
- Lebanon County population projected at +10% by 2050 — modest demand growth; plan on rents tracking national, not racing it.
- 5 sale attempts since 10y ago with the ask held roughly flat each time — persistent listings suggest the price (not the market) is what's stuck; bring a comps-based counter.
- Current owner paid $58k; list at $88k implies a 51% gain — meaningful room to come down on a strong offer.
- At projected returns (-3.0% appreciation + 7.4% rent growth), your $25k cash investment doubles in ~9 years — after that, you're playing with house money.
- Climate carrying-cost: extreme-heat days projected 7→15/yr by 2055 (HVAC capex compounding) — expect insurance premiums to compound above CPI over the hold.
- Cap rate 7.0% vs local median 1.4% in Sand Hill — top-decile yield for the area; either an underpriced asset or a hidden risk that comps aren't pricing in. Stress-test before assuming the spread holds.
Questions for listing agent
- What does the HOA fee cover, when was the last increase, and are there any pending special assessments or reserve-fund shortfalls?
- Is there a deadline driving the sale (1031 exchange, divorce, estate, relocation)? That informs how much negotiation room exists.
- Schools are F-rated, which usually means shorter tenancies and higher turnover. Who's the typical renter profile here, and what's been the actual vacancy rate?
- What's the average days-on-market for RENTAL listings here right now (not sales)? A rising rental-DOM trend means longer vacancies and softer asking-rent achievability than the comps imply.
- What's the recent tenant-quality profile in this submarket — average credit score on applications, eviction rate, late-payment / NSF rate, and stable-employment percentage? A property-management company in the area should have these aggregated.
- How much new for-sale + rental construction is in the pipeline within 1–3 miles? Heavy new supply typically softens prices + rents 12–24 months out; constrained supply supports both.
CashFlowRE · CFR-GECCRB9XZWDP2G
· Data 3 weeks ago
cashflowre.app · 2026-05-29