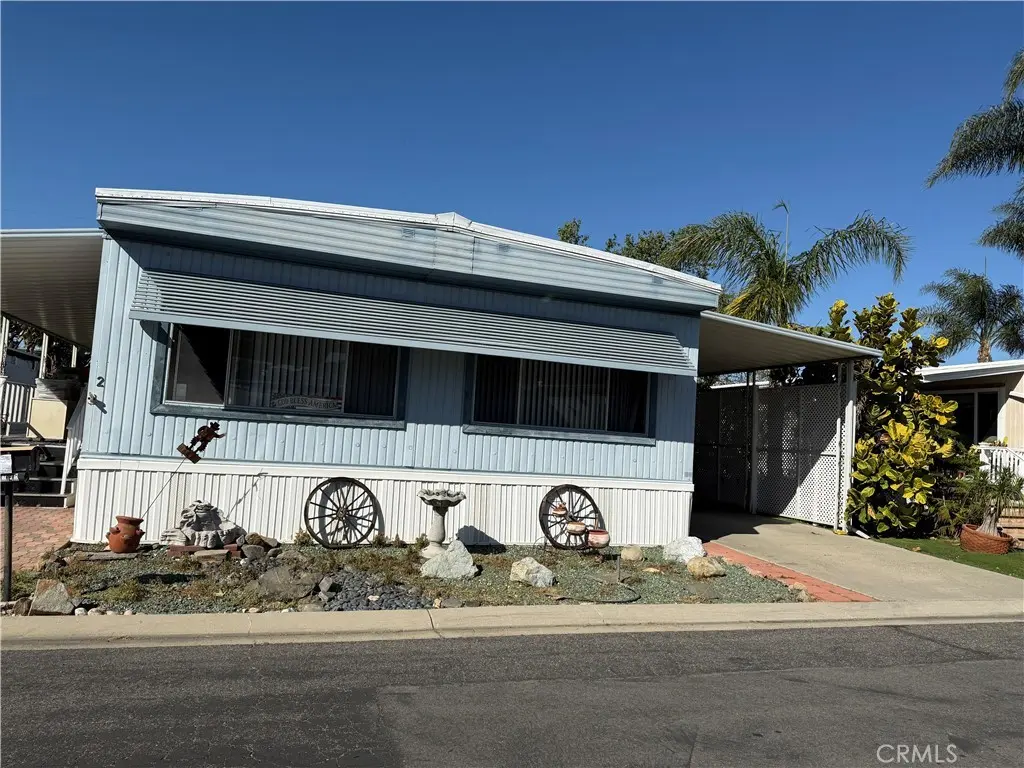
26000 Avenida Aeropuerto #2
San Juan Capistrano, CA 92675
$330,000A-
2 bd · 2.0 ba ·
1,440 sqft ·
Built 1970
· Manufactured
· Pending Sale
· 55 DOM
Cashflow @ list (25.0% down · 7.5%)
Estimated rent
$4,808/mo
Mortgage (P&I)
−$1,731
Tax + insurance
−$672
HOA
−$0
Vac / Maint / Mgmt
−$1,010
Net cashflow
$1,396/mo
Annual
$16,747/yr
Cap rate
11.81%
Cash-on-cash
19.71%
DSCR
1.88
1% rule
1.46%
Cash to close
$92,400
Investor read
- This is a 2-bed/2.0-bath manufactured listed at $330k.
- At list price, monthly cash flow is $1k ($17k/yr) — positive.
- The deal already cash-flows at list — no discount required.
- Meets the 1% rule at list price ($5k rent vs $330k).
- It's been on market 55 days — a 3% lower offer ($320k) is reasonable based on typical stale-listing flexibility.
- Recommended offer: $320k (3.0% below list) — sets the bar for market timing.
- Local home prices are declining (-3.0%/yr); year-one equity from $2k of loan paydown is wiped out by about $10k of value loss. Plan a longer hold.
- Location reads 75/100 on livability (#114 in CA, #4,023 nationally) — a middle-class / working-renter tenant base. Strengths: amenities A+, commute A+, employment A+; Watch: health & safety D+, cost of living F.
- Capistrano Unified (suburban): math 50% / reading 72% proficiency, ranked #64 of 517 in CA (top 12%) — acceptable for families but not a draw, mixed tenant base, ~2y average lease; only 19% free/reduced lunch — higher-income household profile.
- Zoned schools: Del Obispo Elementary (319 students, 65% FRL); Marco Forster Middle (math 24% / reading 24%, grade F, #277 of 498 statewide, top 73%, 1,082 students, 70% FRL); San Juan Hills High (math 50% / reading 75%, grade B-, #187 of 1,170 statewide, top 16%, 2,857 students, 35% FRL) — zoned schools average 57% FRL vs 19% district-wide (38 pts higher); higher-poverty schools than district average — tighter screening recommended.
- Zoned-school proficiency averages 44% at this address vs 61% district-wide (-18 pts) — the specific schools serving this property underperform the Capistrano Unified average; the district grade overstates school quality for this exact location.
- Watch-outs: flood insurance adds $122/mo.
- Market conditions: Rents rising fast (+8.2%/yr); 106 active listings in the ZIP; 40 comparable units currently listed for rent nearby; rentals at typical pace (median 23d on market — plan ~3-4 weeks tenant-placement turnaround); 42% of comp listings sitting > 30 days — soft ceiling on asking rent; high-income renter base; 6,974 units permitted in Orange County in 2024 (3,839 in 5+ unit buildings).
- Orange County population projected at +14% by 2050 — modest demand growth; plan on rents tracking national, not racing it.
- 2 sale attempts with the ask held roughly flat each time — persistent listings suggest the price (not the market) is what's stuck; bring a comps-based counter.
- At projected returns (-3.0% appreciation + 8.0% rent growth), your $92k cash investment doubles in ~6 years — after that, you're playing with house money.
- Climate carrying-cost: in FEMA flood zone AO (mandatory federal flood insurance); extreme-heat days projected 7→23/yr by 2055 (HVAC capex compounding) — expect insurance premiums to compound above CPI over the hold.
- Cap rate 11.8% vs local median 2.3% in San Juan Capistrano — top-decile yield for the area; either an underpriced asset or a hidden risk that comps aren't pricing in. Stress-test before assuming the spread holds.
Questions for listing agent
- It's been on market 55 days. Have you received any prior offers? Is the seller open to a 3% concession, seller financing, or rate buy-down credit?
- Built in 1970 — when were the roof, HVAC, electrical panel, plumbing, and water heater last replaced?
- What's the actual annual flood-insurance premium (NFIP or private), and is the property in a SFHA with mandatory coverage?
- Is there a deadline driving the sale (1031 exchange, divorce, estate, relocation)? That informs how much negotiation room exists.
- What's the average days-on-market for RENTAL listings here right now (not sales)? A rising rental-DOM trend means longer vacancies and softer asking-rent achievability than the comps imply.
- What's the recent tenant-quality profile in this submarket — average credit score on applications, eviction rate, late-payment / NSF rate, and stable-employment percentage? A property-management company in the area should have these aggregated.
- How much new for-sale + rental construction is in the pipeline within 1–3 miles? Heavy new supply typically softens prices + rents 12–24 months out; constrained supply supports both.
CashFlowRE · CFR-GF9YVQEC0DJ2D4
· Data 21 h ago
cashflowre.app · 2026-05-29