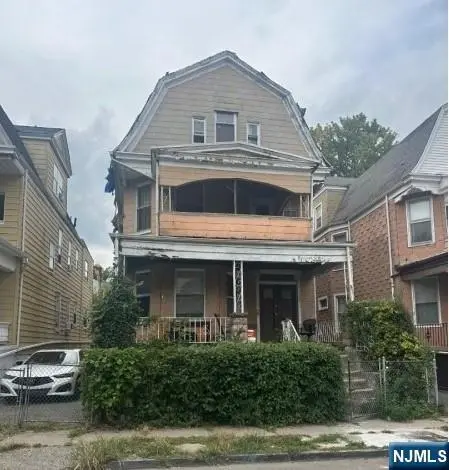
199 Amherst St
East Orange, NJ 07018
$399,999F
7 bd · 3.0 ba ·
2,970 sqft ·
Built 1930
· SingleFamily
· Active
· 18 DOM
Cashflow @ list (25.0% down · 7.5%)
Estimated rent
$2,906/mo
Mortgage (P&I)
−$2,098
Tax + insurance
−$1,139
HOA
−$0
Vac / Maint / Mgmt
−$610
Net cashflow
$-940/mo
Annual
$-11,285/yr
Cap rate
3.47%
Cash-on-cash
-10.08%
DSCR
0.55
1% rule
0.73%
Cash to close
$112,000
Investor read
- This is a 7-bed/3.0-bath single-family listed at $400k.
- At list price, monthly cash flow is $-940 ($-11k/yr) — negative.
- To cash-flow at today's rent, offer at most $234k (41.5% below list).
- To meet the 1% rule (rent ≥ 1% of price), the offer needs to be $291k (27.3% below list).
- It's been on market 18 days — a 2% lower offer ($394k) is reasonable based on typical stale-listing flexibility.
- Recommended offer: $234k (41.5% below list) — sets the bar for cash-flow.
- Local home prices are declining (-3.0%/yr); year-one equity from $3k of loan paydown is wiped out by about $12k of value loss. Plan a longer hold.
- Location reads 73/100 on livability (#189 in NJ) — a middle-class / working-renter tenant base. Strengths: commute A+, health & safety A, housing A-; Watch: schools C-, crime D-, amenities F.
- East Orange School District (suburban): math 6% / reading 31% proficiency, ranked #444 of 472 in NJ (top 94%) — low school quality limits family demand, transient renter base, plan for 1-2y turnover; 63% free/reduced lunch — lower-income household profile, screen leases tightly.
- Watch-outs: property tax is 2.9% of price; built in 1930 — expect roof / HVAC / electrical / plumbing capex.
- Market conditions: Rents rising fast (+4.8%/yr); 23 active listings in the ZIP; 3,364 units permitted in Essex County in 2024 (2,551 in 5+ unit buildings).
- Essex County population projected at +3% by 2050 — modest demand growth; plan on rents tracking national, not racing it.
- 3 sale attempts with the ask held roughly flat each time — persistent listings suggest the price (not the market) is what's stuck; bring a comps-based counter.
- Climate carrying-cost: major wind risk, 27% chance of damaging wind over 30y; extreme-heat days projected 7→15/yr by 2055 (HVAC capex compounding) — expect insurance premiums to compound above CPI over the hold.
- At $2,906/mo this rent would consume 56% of the median local household income ($63k/yr) (locally 2032% of renters already pay >50% of income on rent) — very limited rent-growth headroom before tenants either downsize or default.
Questions for listing agent
- What do current leases actually rent for vs. the listed asking? Can we see a recent rent roll and the last 12 months of T-12 income?
- Built in 1930 — when were the roof, HVAC, electrical panel, plumbing, and water heater last replaced?
- Property tax is high relative to price — has the assessment been appealed recently, and will the sale trigger a re-assessment?
- Is there a deadline driving the sale (1031 exchange, divorce, estate, relocation)? That informs how much negotiation room exists.
- Crime grade is D in this area — have there been break-ins, vandalism, or insurance claims at this property in the last 3 years? What carrier currently insures it and at what premium?
- The area grade is low — what's the realistic commute time and amenity access for the typical tenant pool here? Any planned neighborhood developments (good or bad) we should know about?
- What's the average days-on-market for RENTAL listings here right now (not sales)? A rising rental-DOM trend means longer vacancies and softer asking-rent achievability than the comps imply.
- What's the recent tenant-quality profile in this submarket — average credit score on applications, eviction rate, late-payment / NSF rate, and stable-employment percentage? A property-management company in the area should have these aggregated.
CashFlowRE · CFR-GFQZ3R5YFSKV1G
· Data 1 week ago
cashflowre.app · 2026-05-29