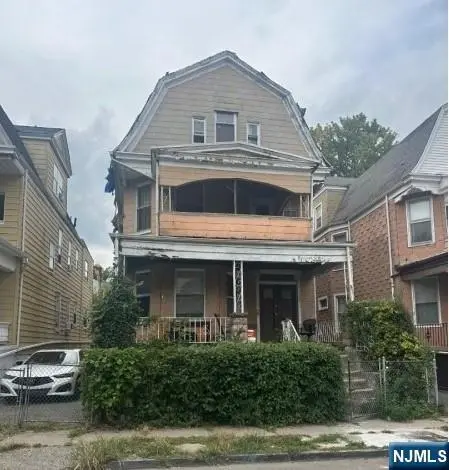
199 Amherst St · East Orange, NJ
Flood risk 1/10 · Minimal
- FEMA flood zone
- X (unshaded)
- Chance of flooding over 30 yrs
- 0.0%
- Est. flood insurance / yr
- $507 – $1,088
Fire risk 1/10 · Minimal
- Est. fire insurance / yr
- $526 – $976
Heat risk 7/10 · Major
- Hot days now (above 100°F)
- 7 days/yr
- Hot days in 30 yrs
- 15 days/yr
Wind risk 6/10 · Moderate
- Chance of severe wind over 30 yrs
- 27.0%
Air-quality risk 4/10 · Minor
- Unhealthy air days now
- 3 days/yr
- Unhealthy air days in 30 yrs
- 5 days/yr
Risk factors via First Street. Map © Google.
Why this score? — see what drove the F grade
The composite is a weighted blend of 9 inputs, each scored 0–100. Each bar is that input's sub-score; the figure is the points it added to the 100-point composite (weight × sub-score).
- ARV discount +7.5/15.0
- Cash flow +5.0/30.0
- Rent growth +3.7/5.0
- Livability +3.7/5.0
- Condition / age +2.5/5.0
- 1% rule +2.3/10.0
- Schools +1.6/10.0
- DSCR +0.0/10.0
- Appreciation +0.0/10.0
$399,999
🖨 Deal sheet 📄 Offer letter ✓ Due diligence
Listing remarks MLS
Property needs full gut renovation and is being sold in as is condition, Short sale subject to a third party approval. Buyer will be responsible for all certificates required to close.
Key facts
- 3,302 sq ft lot
- Listed 18 days
Property features AI
Finance
- Financial info: Annual tax amount reported
Exterior
- Utilities: Natural gas available and connected
- Home design: Residential income property; Multi-family
Interior
- Bedrooms: 3 full bathrooms
- Bathrooms: 3 full bathrooms
- Interior features: 14 total rooms
Neighborhood map
What this means for you Summary
Snapshot
- This is a 7-bed/3.0-bath single-family listed at $400k.
Deal economics
- At list price, monthly cash flow is $-940 ($-11k/yr) — negative.
- To cash-flow at today's rent, offer at most $234k (41.5% below list).
- To meet the 1% rule (rent ≥ 1% of price), the offer needs to be $291k (27.3% below list).
- Recommended offer: $234k (41.5% below list) — sets the bar for cash-flow.
Location & tenants
- Location reads 73/100 on livability (#189 in NJ) — a middle-class / working-renter tenant base. Strengths: commute A+, health & safety A, housing A-; Watch: schools C-, crime D-, amenities F.
- East Orange School District (suburban): math 6% / reading 31% proficiency, ranked #444 of 472 in NJ (top 94%) — low school quality limits family demand, transient renter base, plan for 1-2y turnover; 63% free/reduced lunch — lower-income household profile, screen leases tightly.
- Market conditions: Rents rising fast (+4.8%/yr); 23 active listings in the ZIP; 3,364 units permitted in Essex County in 2024 (2,551 in 5+ unit buildings).
- At $2,906/mo this rent would consume 56% of the median local household income ($63k/yr) (locally 2032% of renters already pay >50% of income on rent) — very limited rent-growth headroom before tenants either downsize or default.
Forward outlook
- Local home prices are declining (-3.0%/yr); year-one equity from $3k of loan paydown is wiped out by about $12k of value loss. Plan a longer hold.
- Essex County population projected at +3% by 2050 — modest demand growth; plan on rents tracking national, not racing it.
Negotiation context
- It's been on market 18 days — a 2% lower offer ($394k) is reasonable based on typical stale-listing flexibility.
- 3 sale attempts with the ask held roughly flat each time — persistent listings suggest the price (not the market) is what's stuck; bring a comps-based counter.
Risks & watch-outs
- Watch-outs: property tax is 2.9% of price; built in 1930 — expect roof / HVAC / electrical / plumbing capex.
- Climate carrying-cost: major wind risk, 27% chance of damaging wind over 30y; extreme-heat days projected 7→15/yr by 2055 (HVAC capex compounding) — expect insurance premiums to compound above CPI over the hold.
Questions for the listing agent
- What do current leases actually rent for vs. the listed asking? Can we see a recent rent roll and the last 12 months of T-12 income?
- Built in 1930 — when were the roof, HVAC, electrical panel, plumbing, and water heater last replaced?
- Property tax is high relative to price — has the assessment been appealed recently, and will the sale trigger a re-assessment?
- Is there a deadline driving the sale (1031 exchange, divorce, estate, relocation)? That informs how much negotiation room exists.
- Crime grade is D in this area — have there been break-ins, vandalism, or insurance claims at this property in the last 3 years? What carrier currently insures it and at what premium?
- The area grade is low — what's the realistic commute time and amenity access for the typical tenant pool here? Any planned neighborhood developments (good or bad) we should know about?
- What's the average days-on-market for RENTAL listings here right now (not sales)? A rising rental-DOM trend means longer vacancies and softer asking-rent achievability than the comps imply.
- What's the recent tenant-quality profile in this submarket — average credit score on applications, eviction rate, late-payment / NSF rate, and stable-employment percentage? A property-management company in the area should have these aggregated.
- How much new for-sale + rental construction is in the pipeline within 1–3 miles? Heavy new supply typically softens prices + rents 12–24 months out; constrained supply supports both.
Investment metrics
- 1% rule
- 0.73% ✗
- Cap rate
- 3.47%
- Cash-on-cash
- -10.08%
- DSCR
- 0.55
- GRM
- 11.5
CMA / ARV
No comps found within radius.
Projected returns pro-forma
-3.0% appreciation · 4.85% rent growth · sell at horizon
- IRR
- -31.8%
- Equity multiple
- -0.06×
- Total profit
- $-118,869
- Equity at exit
- $59,641
- IRR
- -26.5%
- Equity multiple
- -0.39×
- Total profit
- $-155,799
- Equity at exit
- $34,585
Cash invested: $112,000 (down + closing). Projections, not guarantees.
Landlord ↔ Tenant lean methodology
- Overall (STATE)
- 21 Tenant-Leaning
- State New Jersey
- 21 Tenant-Leaning · D+6
- County
- — inherits STATE
- City
- — inherits STATE
ZIP-level market 07018
- Home prices YoY
- -20.1%
- Rents YoY
- 4.8%
- Active inventory
- 23
- Price-to-rent
- 11.5×
Monthly cashflow live
- Estimated rent
- $2,906 medium interval (Pro) →
- Mortgage (P&I)
- −$2,098
- Tax from tax record
- −$972 /mo · $11,664/yr
- Insurance
- −$167
- HOA
- −$0
- Vacancy / Maint / Mgmt
- −$610
- Net cashflow
- $-940
Break-even live
UW: 25.0% down · 7.5% · 30yr · 1.5% tax · 5.0% vac · 8.0% maint · 8.0% mgmt
Financing live
Cash to close
- Down payment
- $100,000
- Closing costs
- $12,000
- Reserves months
- —
- Total cash needed
- —
Loan-product check · same deal, 3 products live
Conventional
25% down · 7.5% · 30yr
- Down + closing
- —
- Monthly P&I
- —
- Monthly cashflow
- —
- DSCR
- —
- Eligible?
- —
Personal DTI + credit; lowest rate.
DSCR
20% down · 8.5% · 30yr
- Down + closing
- —
- Monthly P&I
- —
- Monthly cashflow
- —
- DSCR
- —
- Eligible?
- —
No personal income docs; deal must DSCR.
Hard money
10% down · 12.0% · 12mo
- Down + closing
- —
- Monthly P&I
- —
- Monthly cashflow
- —
- DSCR
- —
- Eligible?
- —
Short-term bridge; refi at stabilization.
Listing history 14 events
-
2026-06-09days on market $399,999 Active 18 DOM
-
2026-06-08days on market $399,999 Active 17 DOM
-
2026-06-07days on market $399,999 Active 16 DOM
-
2026-06-04days on market $399,999 Active 13 DOM
-
2026-06-03days on market $399,999 Active 12 DOM
-
2026-06-02days on market $399,999 Active 11 DOM
-
2026-06-01days on market $399,999 Active 10 DOM
-
2026-05-31days on market $399,999 Active 9 DOM
-
2026-05-22status Under Contract 184-char remark
Show marketing remark (184 chars)
Property needs full gut renovation and is being sold in as is condition, Short sale subject to a third party approval. Buyer will be responsible for all certificates required to close.
-
2026-05-22$399,999 Active 184-char remark
Show marketing remark (184 chars)
Property needs full gut renovation and is being sold in as is condition, Short sale subject to a third party approval. Buyer will be responsible for all certificates required to close.
-
2026-05-22$399,999 Active
Show marketing remark (184 chars)
Property needs full gut renovation and is being sold in as is condition, Short sale subject to a third party approval. Buyer will be responsible for all certificates required to close.
-
2025-10-01historical Active Under Contract
-
2025-10-01price $299,999
-
2025-09-30$399,999 Active
ⓘ Source: listings_history table (triggers on properties + properties_extension) + one-shot
backfill from property_details.listing_events for pre-trigger history.
Tax reassessment forecast NJ · Partial reset (capped growth)
- Current annual tax
- $11,664 · $972/mo
- Projected year-2 tax
- $11,664 · $972/mo
- Expected delta
- $0/yr ($0/mo · 0.0%)
ⓘ Screening estimate from a state-policy table — verify with the county assessor before closing.
Climate risk First Street
- Flood 1/10 Low FEMA zone X (unshaded) · 0% chance over 30 yrs
- Wildfire 1/10 Low
- Heat 7/10 Severe 7 d/yr ≥100°F today · 15 d/yr by 30 yrs out
- Wind 6/10 Major 27% chance of damaging wind over 30 yrs
- Air quality 4/10 Moderate 3 unhealthy d/yr today · 5 by 30 yrs out
Nearby sold comps map
Loading sold comps map…
Walkable amenities ~0.75 mi
Loading nearby amenities…
Taxation est. · year 1
- Rental income
- $34,875
- − Mortgage interest
- −$22,406
- − Property taxes
- −$11,664
- − Insurance
- −$2,000
- − Repairs & maintenance
- −$2,790
- − Management
- −$2,790
- − Depreciation
- −$11,636
- Taxable loss
- −$18,412
- Est. tax savings @ 24.0%
- +$4,419
- After-tax cash flow
- $-6,866/yr
For passive investors: Depreciation is non-cash, so a rental often shows a tax loss while cash-flowing — sheltering income. Rental losses are passive: they offset passive income freely, and up to $25,000/yr can offset ordinary (W-2) income if you actively participate and your MAGI is under $100k (phasing out to $0 by $150k); unused losses carry forward. On sale, claimed depreciation is recaptured at up to 25%, and gains may owe capital-gains tax (a 1031 exchange can defer both). Figures are a year-1 estimate at your 24.0% rate — not tax advice; consult a CPA.
Schools (NCES district)
- District
- East Orange School District
- NCES district ID
- 3404230
- Math proficiency
- 6% ▼ -11.00%
- Reading proficiency
- 31% ▼ -9.00%
- Median HH income
- $39,490
- Composite
- 15.56/100
- National rank
- #9295
- State rank
- #444 of 472 in NJ
Livability — East Orange
- Score
- 73/100
- State rank
- #189
- US rank
- #5261
Category grades
Schools grade is shown separately in the Schools card above.
Census & demographics
- Census place
- East Orange, NJ
- County
- Essex County · 825,405 people
- City population
- 69,834
- Metro
- New York-Newark-Jersey City, NY-NJ-PA
- Population (ZIP)
- 28,924
- Household income
- $62,564
- Rent vs Own
- Severe rent burden
- 2032.0
Population outlook (Essex County) Hauer SSP2
- Today (2025)
- 825,042 people
- By 2030
- 834,010 · +1.1%
- By 2040
- 846,221 · +2.6%
- By 2050
- 850,047 · +3.0%
- By 2075
- 837,009 · +1.5%
- By 2100
- 784,345 · -4.9%
Race, ethnicity, and origin ACS 2023
- Neighborhood character
- Predominantly Black (83%)
- Race & ethnicity
- Black 83% Hispanic / Latino 7% Two or more races 6% Asian 2% White 2%
- Hispanic origin (detail)
- Puerto Rican 4%
- Common ancestry
- Hispanic 5%
- Foreign-born
- 33% · Canada, United Kingdom, Mexico
- Languages at home
- 80% English-only · French/Haitian/Cajun 7% Spanish 4% Arabic 1%
Political lean MEDSL · Essex
- 2024 margin
- Solid D (+44.9) · D 71.7% · R 26.8% · Other 1.5%
- 2008→2024 swing
- -7.7pp toward R · 2008: 52.6pp · 2024: 44.9pp
- All cycles
- 2024: D+44.9 2020: D+55.4 2016: D+56.4 2012: D+55.5 2008: D+52.6
Not yet ingested
- Civics
- —
Market trends
- HPI YoY
- ▼ -73.24%
- Current HPI
- 290.9606
- Rent YoY
- ▲ 4.85%
- Metro
- New York-Newark-Jersey City, NY-NJ-PA
- State GDP YoY
- ▲ 2.05%
- F500 in state
- 34
Industry mix (Fortune 500 HQ in NJ)
| Industry | F500 HQs | Revenue |
|---|---|---|
| Consumer Goods | 3 | $31B |
|
||
| Pharmaceuticals | 2 | $153B |
|
||
| Technology | 2 | $21B |
|
||
| Insurance | 2 | $20B |
|
||
| Healthcare | 2 | $19B |
|
||
| Financial Services | 1 | $70B |
|
||
Price history
+0.0% since first listed6 events — show timeline
- 2026-05-22 Pending — GSMLS
- 2026-05-22 Listed $399,999 NJMLS
- 2026-05-22 Listed $399,999 GSMLS
- 2025-10-01 Contingent — NJMLS
- 2025-10-01 Price Changed $299,999 NJMLS
- 2025-09-30 Listed $399,999 NJMLS
Property tax history
+3.4%/yrLatest (2025): $11,664 · +3.2% YoY. Source: county tax records.
Cash-flow waterfall
monthlySold comps — $/sqft
last 12 mo · ≤1 miLoading sold comps…