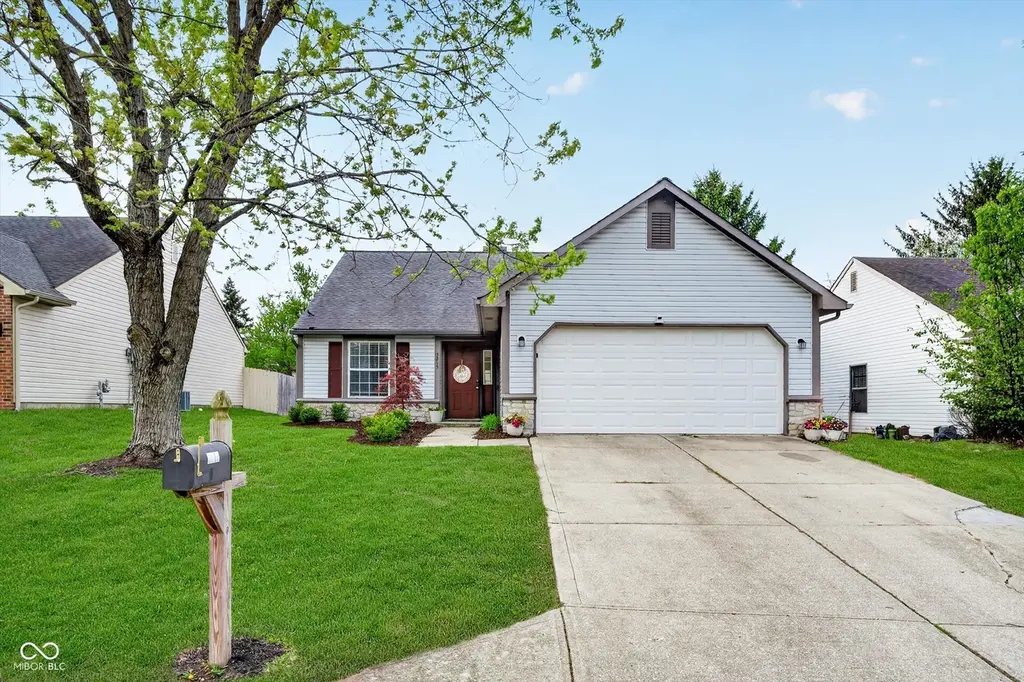
3215 Village Park North Dr
Westfield, IN 46033
$315,000D
3 bd · 2.0 ba ·
1,462 sqft ·
Built 1990
· SingleFamily
· Pending
· 3 DOM
Cashflow @ list (25.0% down · 7.5%)
Estimated rent
$2,435/mo
Mortgage (P&I)
−$1,652
Tax + insurance
−$372
HOA
−$26
Vac / Maint / Mgmt
−$511
Net cashflow
$-126/mo
Annual
$-1,517/yr
Cap rate
5.81%
Cash-on-cash
-1.72%
DSCR
0.92
1% rule
0.77%
Cash to close
$88,200
Investor read
- This is a 3-bed/2.0-bath single-family listed at $315k.
- At list price, monthly cash flow is $-126 ($-2k/yr) — negative.
- To cash-flow at today's rent, offer at most $293k (7.1% below list).
- To meet the 1% rule (rent ≥ 1% of price), the offer needs to be $243k (22.7% below list).
- Only 3 days on market — expect competitive offers; lowballing is unlikely to land.
- Recommended offer: $243k (22.7% below list) — sets the bar for 1% rule.
- Local home prices are declining (-3.0%/yr); year-one equity from $2k of loan paydown is wiped out by about $9k of value loss. Plan a longer hold.
- Location reads 71/100 on livability (#140 in IN) — a middle-class / working-renter tenant base. Strengths: crime A+, employment A+, housing A+; Watch: amenities F, commute F, health & safety F.
- Westfield-Washington Schools (suburban): math 58% / reading 64% proficiency, ranked #10 of 301 in IN (top 3%) — acceptable for families but not a draw, mixed tenant base, ~2y average lease; only 14% free/reduced lunch — higher-income household profile.
- Zoned schools: Carey Ridge Elementary School (math 73% / reading 63%, grade B+, #49 of 994 statewide, top 5%, 635 students, 22% FRL); Westfield High School (math 61% / reading 85%, grade B+, #8 of 369 statewide, top 2%, 2,665 students, 18% FRL).
- Market conditions: Rents rising fast (+8.4%/yr); 193 active listings in the ZIP; 1 comparable units currently listed for rent nearby; high-income renter base; 4,661 units permitted in Hamilton County in 2024 (1,528 in 5+ unit buildings).
- Hamilton County population projected at +44% by 2050 — long-run rental-demand tailwind backs the buy-and-hold thesis.
- 3 sale attempts since 11y ago with the ask held roughly flat each time — persistent listings suggest the price (not the market) is what's stuck; bring a comps-based counter.
- Cap rate 5.8% vs local median 3.0% in Westfield — top-decile yield for the area; either an underpriced asset or a hidden risk that comps aren't pricing in. Stress-test before assuming the spread holds.
Questions for listing agent
- What do current leases actually rent for vs. the listed asking? Can we see a recent rent roll and the last 12 months of T-12 income?
- What does the HOA fee cover, when was the last increase, and are there any pending special assessments or reserve-fund shortfalls?
- Is there a deadline driving the sale (1031 exchange, divorce, estate, relocation)? That informs how much negotiation room exists.
- Schools are A-rated — typically a magnet for longer-tenancy family renters. What's the average tenant stay here, and is there a school-zone premium baked into asking?
- The area grade is low — what's the realistic commute time and amenity access for the typical tenant pool here? Any planned neighborhood developments (good or bad) we should know about?
- What's the average days-on-market for RENTAL listings here right now (not sales)? A rising rental-DOM trend means longer vacancies and softer asking-rent achievability than the comps imply.
- What's the recent tenant-quality profile in this submarket — average credit score on applications, eviction rate, late-payment / NSF rate, and stable-employment percentage? A property-management company in the area should have these aggregated.
- How much new for-sale + rental construction is in the pipeline within 1–3 miles? Heavy new supply typically softens prices + rents 12–24 months out; constrained supply supports both.
CashFlowRE · CFR-GFSCRE5X8XKQ43
· Data 3 weeks ago
cashflowre.app · 2026-05-29