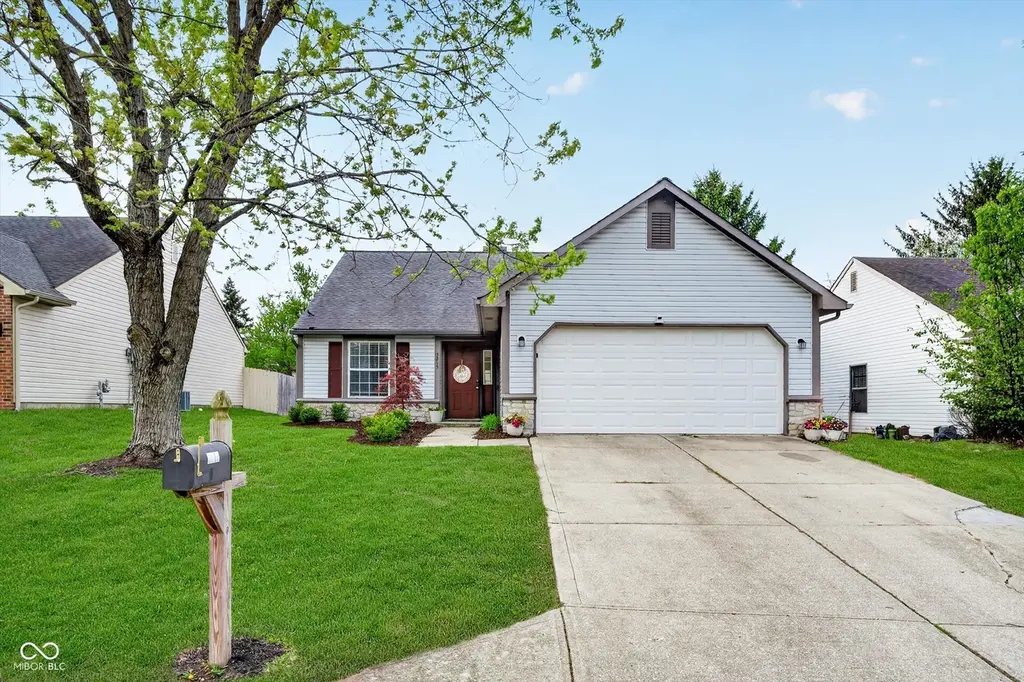
3215 Village Park North Dr · Westfield, IN
Flood risk 1/10 · Minimal
- FEMA flood zone
- X (unshaded)
- Chance of flooding over 30 yrs
- 0.0%
- Est. flood insurance / yr
- $507 – $1,088
Fire risk 1/10 · Minimal
- Est. fire insurance / yr
- $717 – $1,331
Heat risk 4/10 · Minor
- Hot days now (above 101°F)
- 7 days/yr
- Hot days in 30 yrs
- 18 days/yr
Wind risk 2/10 · Minimal
- Chance of severe wind over 30 yrs
- 0.0%
Air-quality risk 4/10 · Minor
- Unhealthy air days now
- 3 days/yr
- Unhealthy air days in 30 yrs
- 5 days/yr
Risk factors via First Street. Map © Google.
Why this score? — see what drove the D grade
The composite is a weighted blend of 9 inputs, each scored 0–100. Each bar is that input's sub-score; the figure is the points it added to the 100-point composite (weight × sub-score).
- Cash flow +11.1/30.0
- ARV discount +8.2/15.0
- Schools +5.5/10.0
- Rent growth +4.6/5.0
- Livability +3.6/5.0
- DSCR +3.2/10.0
- 1% rule +2.7/10.0
- Condition / age +2.5/5.0
- Appreciation +0.0/10.0
$315,000
🖨 Deal sheet 📄 Offer letter ✓ Due diligence
Listing remarks MLS
Welcome to this 3 bedroom 2 full bath ranch. This open floor plan features a ceramic fireplace, vaulted ceiling in great room which extends to the kitchen. The spacious primary bedroom offers a nice walk-in closet. Be sure to check out the screened-in porch that overlooks the large back yard. Shopping, restaurants and more just minutes away. Welcome home!
Key facts
- Updated lvp flooring
- Walk in closet
- Granite countertops
Tags
Neighborhood map
What this means for you Summary
Snapshot
- This is a 3-bed/2.0-bath single-family listed at $315k.
Deal economics
- At list price, monthly cash flow is $-126 ($-2k/yr) — negative.
- To cash-flow at today's rent, offer at most $293k (7.1% below list).
- To meet the 1% rule (rent ≥ 1% of price), the offer needs to be $243k (22.7% below list).
- Recommended offer: $243k (22.7% below list) — sets the bar for 1% rule.
- Cap rate 5.8% vs local median 3.0% in Westfield — top-decile yield for the area; either an underpriced asset or a hidden risk that comps aren't pricing in. Stress-test before assuming the spread holds.
Location & tenants
- Location reads 71/100 on livability (#140 in IN) — a middle-class / working-renter tenant base. Strengths: crime A+, employment A+, housing A+; Watch: amenities F, commute F, health & safety F.
- Westfield-Washington Schools (suburban): math 58% / reading 64% proficiency, ranked #10 of 301 in IN (top 3%) — acceptable for families but not a draw, mixed tenant base, ~2y average lease; only 14% free/reduced lunch — higher-income household profile.
- Zoned schools: Carey Ridge Elementary School (math 73% / reading 63%, grade B+, #49 of 994 statewide, top 5%, 635 students, 22% FRL); Westfield High School (math 61% / reading 85%, grade B+, #8 of 369 statewide, top 2%, 2,665 students, 18% FRL).
- Market conditions: Rents rising fast (+8.4%/yr); 193 active listings in the ZIP; 1 comparable units currently listed for rent nearby; high-income renter base; 4,661 units permitted in Hamilton County in 2024 (1,528 in 5+ unit buildings).
Forward outlook
- Local home prices are declining (-3.0%/yr); year-one equity from $2k of loan paydown is wiped out by about $9k of value loss. Plan a longer hold.
- Hamilton County population projected at +44% by 2050 — long-run rental-demand tailwind backs the buy-and-hold thesis.
Negotiation context
- Only 3 days on market — expect competitive offers; lowballing is unlikely to land.
- 3 sale attempts since 11y ago with the ask held roughly flat each time — persistent listings suggest the price (not the market) is what's stuck; bring a comps-based counter.
Questions for the listing agent
- What do current leases actually rent for vs. the listed asking? Can we see a recent rent roll and the last 12 months of T-12 income?
- What does the HOA fee cover, when was the last increase, and are there any pending special assessments or reserve-fund shortfalls?
- Is there a deadline driving the sale (1031 exchange, divorce, estate, relocation)? That informs how much negotiation room exists.
- Schools are A-rated — typically a magnet for longer-tenancy family renters. What's the average tenant stay here, and is there a school-zone premium baked into asking?
- The area grade is low — what's the realistic commute time and amenity access for the typical tenant pool here? Any planned neighborhood developments (good or bad) we should know about?
- What's the average days-on-market for RENTAL listings here right now (not sales)? A rising rental-DOM trend means longer vacancies and softer asking-rent achievability than the comps imply.
- What's the recent tenant-quality profile in this submarket — average credit score on applications, eviction rate, late-payment / NSF rate, and stable-employment percentage? A property-management company in the area should have these aggregated.
- How much new for-sale + rental construction is in the pipeline within 1–3 miles? Heavy new supply typically softens prices + rents 12–24 months out; constrained supply supports both.
Investment metrics
- 1% rule
- 0.77% ✗
- Cap rate
- 5.81%
- Cash-on-cash
- -1.72%
- DSCR
- 0.92
- GRM
- 10.8
CMA / ARV
- ARV (on-the-fly)
- $320,178
- Comps found
- 12
Show comp detail 12 sales within ~0.75 mi
| Address | Dist | Beds/Ba | Sqft | Sold | Price | $/sf | Match |
|---|---|---|---|---|---|---|---|
| 3215 Village Park North Dr | 0.00mi | 3/2.0 | 1,462 (0%) | 1mo | $320,000 | $219 | 100 |
| 14610 Village Park Dr E | 0.19mi | 3/2.0 | 1,460 (-0%) | 5mo | $312,000 | $214 | 87 |
| 3239 Village Park North Dr | 0.03mi | 3/2.0 | 1,314 (-10%) | 1mo | $300,000 | $228 | 81 |
| 3122 Village Park North Dr | 0.06mi | 3/2.0 | 1,296 (-11%) | 3mo | $275,000 | $212 | 76 |
| 14910 Mia Dr | 0.43mi | 3/2.0 | 1,456 (-0%) | 6mo | $317,000 | $218 | 74 |
| 14741 Village Park East Dr | 0.07mi | 3/2.0 | 1,269 (-13%) | 2mo | $279,400 | $220 | 73 |
| 3145 Village Park Dr N | 0.03mi | 2/2.0 (-1) | 1,304 (-11%) | 5mo | $295,000 | $226 | 71 |
| 15015 Silver Thorne Way | 0.50mi | 3/2.0 | 1,540 (+5%) | 2mo | $250,000 | $162 | 66 |
| 14923 Silver Thorne Way | 0.45mi | 3/2.0 | 1,344 (-8%) | 4mo | $320,000 | $238 | 62 |
| 14928 Oak Rd | 0.56mi | 3/2.0 | 1,540 (+5%) | 8mo | $315,000 | $205 | 59 |
| 14906 Mia Dr | 0.45mi | 3/2.0 | 1,620 (+11%) | 8mo | $330,000 | $204 | 54 |
| 2533 Copper Tree Way | 0.50mi | 3/2.0 | 1,272 (-13%) | 2mo | $323,000 | $254 | 53 |
Match score weights: distance 35% · size 25% · config 20% · recency 20%. Top-matched comps best support the ARV.
Projected returns pro-forma
-3.0% appreciation · 8.0% rent growth · sell at horizon
- IRR
- -14.0%
- Equity multiple
- 0.48×
- Total profit
- $-46,270
- Equity at exit
- $46,968
- IRR
- 1.0%
- Equity multiple
- 1.09×
- Total profit
- $7,732
- Equity at exit
- $27,235
Cash invested: $88,200 (down + closing). Projections, not guarantees.
Landlord ↔ Tenant lean methodology
- Overall (STATE)
- 90 Strongly Landlord-Friendly
- State Indiana
- 90 Strongly Landlord-Friendly · R+11
- County
- — inherits STATE
- City
- — inherits STATE
ZIP-level market 46033
- Rents YoY
- 8.4%
- Active inventory
- 193
- Price-to-rent
- 10.8×
Monthly cashflow live
- Estimated rent
- $2,435 medium interval (Pro) →
- Mortgage (P&I)
- −$1,652
- Tax from tax record
- −$241 /mo · $2,886/yr
- Insurance
- −$131
- HOA
- −$26
- Vacancy / Maint / Mgmt
- −$511
- Net cashflow
- $-126
Break-even live
UW: 25.0% down · 7.5% · 30yr · 1.5% tax · 5.0% vac · 8.0% maint · 8.0% mgmt
Financing live
Cash to close
- Down payment
- $78,750
- Closing costs
- $9,450
- Reserves months
- —
- Total cash needed
- —
Loan-product check · same deal, 3 products live
Conventional
25% down · 7.5% · 30yr
- Down + closing
- —
- Monthly P&I
- —
- Monthly cashflow
- —
- DSCR
- —
- Eligible?
- —
Personal DTI + credit; lowest rate.
DSCR
20% down · 8.5% · 30yr
- Down + closing
- —
- Monthly P&I
- —
- Monthly cashflow
- —
- DSCR
- —
- Eligible?
- —
No personal income docs; deal must DSCR.
Hard money
10% down · 12.0% · 12mo
- Down + closing
- —
- Monthly P&I
- —
- Monthly cashflow
- —
- DSCR
- —
- Eligible?
- —
Short-term bridge; refi at stabilization.
Rent comps 1 comps
| Address | Beds | Baths | Sqft | Rent | $/sqft | DOM | Units | Dist |
|---|---|---|---|---|---|---|---|---|
| 2223 E 151st St Carmel, IN | 1.0–3.0 | 1.0–3.0 | 1026 | $1,974 | $1.92 | 2d | 20 | 0.61mi |
HOA detail
- Monthly dues
- $26 · $312/yr
Listing history 10 events
-
2026-04-19status Pending
-
2026-04-16$315,000 Active
-
2023-06-27soldstatus $290,000
-
2023-06-16soldstatus $290,000 Closed 357-char remark
Show marketing remark (357 chars)
Welcome to this 3 bedroom 2 full bath ranch. This open floor plan features a ceramic fireplace, vaulted ceiling in great room which extends to the kitchen. The spacious primary bedroom offers a nice walk-in closet. Be sure to check out the screened-in porch that overlooks the large back yard. Shopping, restaurants and more just minutes away. Welcome home!
-
2023-05-19status Pending 357-char remark
Show marketing remark (357 chars)
Welcome to this 3 bedroom 2 full bath ranch. This open floor plan features a ceramic fireplace, vaulted ceiling in great room which extends to the kitchen. The spacious primary bedroom offers a nice walk-in closet. Be sure to check out the screened-in porch that overlooks the large back yard. Shopping, restaurants and more just minutes away. Welcome home!
-
2023-05-12$299,900 Active 357-char remark
Show marketing remark (357 chars)
Welcome to this 3 bedroom 2 full bath ranch. This open floor plan features a ceramic fireplace, vaulted ceiling in great room which extends to the kitchen. The spacious primary bedroom offers a nice walk-in closet. Be sure to check out the screened-in porch that overlooks the large back yard. Shopping, restaurants and more just minutes away. Welcome home!
-
2015-09-16soldstatus $124,000 Sold 123-char remark
Show marketing remark (123 chars)
PROPERTY FEATURES A CERAMIC FIREPLACE, 9X15 SCREENED- IN PORCH, AND VAULTED CEILING BETWEEN THE KITCHEN AND THE GREAT ROOM.
-
2015-09-02status Pending 123-char remark
Show marketing remark (123 chars)
PROPERTY FEATURES A CERAMIC FIREPLACE, 9X15 SCREENED- IN PORCH, AND VAULTED CEILING BETWEEN THE KITCHEN AND THE GREAT ROOM.
-
2015-08-21status Pending 123-char remark
Show marketing remark (123 chars)
PROPERTY FEATURES A CERAMIC FIREPLACE, 9X15 SCREENED- IN PORCH, AND VAULTED CEILING BETWEEN THE KITCHEN AND THE GREAT ROOM.
-
2015-08-19$129,000 Active 123-char remark
Show marketing remark (123 chars)
PROPERTY FEATURES A CERAMIC FIREPLACE, 9X15 SCREENED- IN PORCH, AND VAULTED CEILING BETWEEN THE KITCHEN AND THE GREAT ROOM.
ⓘ Source: listings_history table (triggers on properties + properties_extension) + one-shot
backfill from property_details.listing_events for pre-trigger history.
Tax reassessment forecast IN · Partial reset (capped growth)
- Current annual tax
- $2,886 · $241/mo
- Projected year-2 tax
- $2,886 · $241/mo
- Expected delta
- $0/yr ($0/mo · -0.0%)
ⓘ Screening estimate from a state-policy table — verify with the county assessor before closing.
Climate risk First Street
- Flood 1/10 Low FEMA zone X (unshaded) · 0% chance over 30 yrs
- Wildfire 1/10 Low
- Heat 4/10 Moderate 7 d/yr ≥101°F today · 18 d/yr by 30 yrs out
- Wind 2/10 Low 0% chance of damaging wind over 30 yrs
- Air quality 4/10 Moderate 3 unhealthy d/yr today · 5 by 30 yrs out
Nearby sold comps map
Loading sold comps map…
Walkable amenities ~0.75 mi
Loading nearby amenities…
Taxation est. · year 1
- Rental income
- $29,214
- − Mortgage interest
- −$17,645
- − Property taxes
- −$2,886
- − Insurance
- −$1,575
- − Repairs & maintenance
- −$2,337
- − Management
- −$2,337
- − HOA
- −$312
- − Depreciation
- −$9,164
- Taxable loss
- −$7,042
- Est. tax savings @ 24.0%
- +$1,690
- After-tax cash flow
- $173/yr
For passive investors: Depreciation is non-cash, so a rental often shows a tax loss while cash-flowing — sheltering income. Rental losses are passive: they offset passive income freely, and up to $25,000/yr can offset ordinary (W-2) income if you actively participate and your MAGI is under $100k (phasing out to $0 by $150k); unused losses carry forward. On sale, claimed depreciation is recaptured at up to 25%, and gains may owe capital-gains tax (a 1031 exchange can defer both). Figures are a year-1 estimate at your 24.0% rate — not tax advice; consult a CPA.
Schools (NCES district)
- District
- Westfield-Washington Schools
- NCES district ID
- 1813080
- Math proficiency
- 58% ▼ -9.00%
- Reading proficiency
- 64% ▼ -3.00%
- Median HH income
- $82,682
- Composite
- 55.01/100
- National rank
- #1295
- State rank
- #10 of 301 in IN
Livability — Westfield
- Score
- 71/100
- State rank
- #140
- US rank
- #7263
Category grades
Schools grade is shown separately in the Schools card above.
Census & demographics
- Census place
- Westfield, IN
- County
- Hamilton County · 337,479 people
- City population
- 48,901
- Metro
- Indianapolis-Carmel-Anderson, IN
- Population (ZIP)
- 40,881
- Household income
- $153,143
- Rent vs Own
- Severe rent burden
- 378.0
Population outlook (Hamilton County) Hauer SSP2
- Today (2025)
- 381,938 people
- By 2030
- 417,496 · +9.3%
- By 2040
- 486,684 · +27.4%
- By 2050
- 549,805 · +44.0%
- By 2075
- 687,078 · +79.9%
- By 2100
- 754,495 · +97.5%
Race, ethnicity, and origin ACS 2023
- Neighborhood character
- Predominantly White (79%)
- Race & ethnicity
- White 79% Asian 8% Two or more races 8% Hispanic / Latino 7% Black 2%
- Hispanic origin (detail)
- Mexican 3% Salvadoran 1%
- Common ancestry
- Romanian 4% Italian 3% Lithuanian 2%
- Foreign-born
- 11% · Canada, China, South Korea
- Languages at home
- 87% English-only · Spanish 4% Chinese 3% Other Asian/Pacific 1%
Political lean MEDSL · Hamilton
- 2024 margin
- Lean R (+6.1) · D 46.0% · R 52.1% · Other 1.9%
- 2008→2024 swing
- +16.2pp toward D · 2008: -22.2pp · 2024: -6.1pp
- All cycles
- 2024: R+6.1 2020: R+6.8 2016: R+19.6 2012: R+34.3 2008: R+22.2
Not yet ingested
- Civics
- —
Market trends
- HPI YoY
- ▼ -199.29%
- Current HPI
- 226.6783
- Rent YoY
- ▲ 8.44%
- Metro
- Indianapolis-Carmel-Anderson, IN
- State GDP YoY
- ▲ 2.90%
- F500 in state
- 18
Industry mix (Fortune 500 HQ in IN)
| Industry | F500 HQs | Revenue |
|---|---|---|
| Industrial Machinery | 2 | $37B |
|
||
| Healthcare | 1 | $177B |
|
||
| Pharmaceuticals | 1 | $45B |
|
||
| Metals / Steel | 1 | $18B |
|
||
| Agriculture | 1 | $17B |
|
||
| Packaging | 1 | $12B |
|
||
Price history
+144.2% since first listed10 events — show timeline
- 2026-04-19 Pending — MIBOR as Distributed by MLS Grid
- 2026-04-16 Listed $315,000 MIBOR as Distributed by MLS Grid
- 2023-06-27 Sold (Public Records) $290,000 Public Records
- 2023-06-16 Sold (MLS) $290,000 MIBOR as Distributed by MLS Grid
- 2023-05-19 Pending — MIBOR as Distributed by MLS Grid
- 2023-05-12 Listed $299,900 MIBOR as Distributed by MLS Grid
- 2015-09-16 Sold (MLS) $124,000 MIBOR as Distributed by MLS Grid
- 2015-09-02 Pending — MIBOR as Distributed by MLS Grid
- 2015-08-21 Pending — MIBOR as Distributed by MLS Grid
- 2015-08-19 Listed $129,000 MIBOR as Distributed by MLS Grid
Property tax history
+0.8%/yrLatest (2025): $2,886 · -6.7% YoY. Source: county tax records.
Cash-flow waterfall
monthlySold comps — $/sqft
last 12 mo · ≤1 miLoading sold comps…