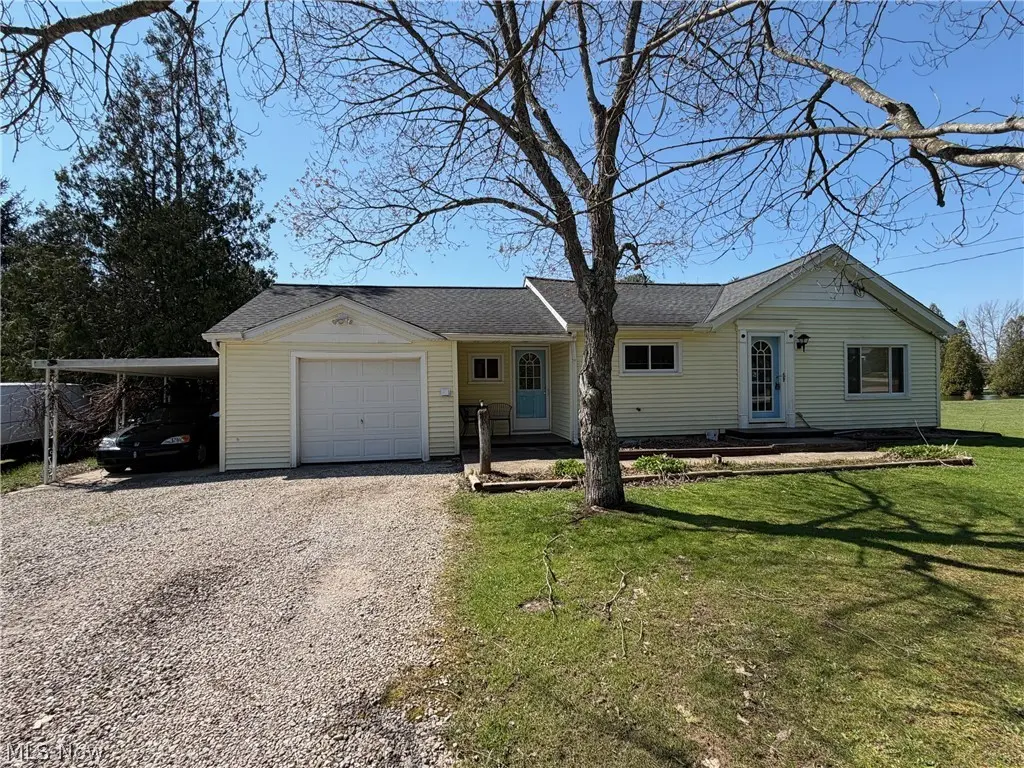
13268 Shady Ln
Chesterland, OH 44026
$184,900A-
2 bd · 1.0 ba ·
864 sqft ·
Built 1952
· SingleFamily
· Active
· 54 DOM
Cashflow @ list (25.0% down · 7.5%)
Estimated rent
$2,847/mo
Mortgage (P&I)
−$970
Tax + insurance
−$289
HOA
−$0
Vac / Maint / Mgmt
−$598
Net cashflow
$991/mo
Annual
$11,887/yr
Cap rate
12.72%
Cash-on-cash
22.96%
DSCR
2.02
1% rule
1.54%
Cash to close
$51,772
Investor read
- This is a 2-bed/1.0-bath single-family listed at $185k.
- At list price, monthly cash flow is $991 ($12k/yr) — positive.
- The deal already cash-flows at list — no discount required.
- Meets the 1% rule at list price ($3k rent vs $185k).
- It's been on market 54 days — a 3% lower offer ($179k) is reasonable based on typical stale-listing flexibility.
- Recommended offer: $179k (3.0% below list) — sets the bar for market timing.
- Local home prices are declining (-3.0%/yr); year-one equity from $1k of loan paydown is wiped out by about $6k of value loss. Plan a longer hold.
- Location reads 84/100 on livability (#58 in OH, #835 nationally) — a professional / high-income tenant draw. Strengths: crime A+, cost of living A+, housing A+; Watch: commute F.
- West Geauga Local (rural): math 83% / reading 86% proficiency, ranked #28 of 656 in OH (top 4%) — strong family-tenant draw, lease renewals of 3-5y typical; only 9% free/reduced lunch — higher-income household profile.
- Zoned schools: Robert C Lindsey Elementary School (math 92% / reading 88%, grade A+, #19 of 1,584 statewide, top 1%, 461 students, 10% FRL); West Geauga Middle School (math 80% / reading 82%, grade A+, #38 of 654 statewide, top 6%, 491 students, 10% FRL); West Geauga High School (math 67% / reading 92%, grade A-, #35 of 781 statewide, top 6%, 693 students, 8% FRL) — zoned schools at 10% FRL track the district average.
- Watch-outs: built in 1952 — expect roof / HVAC / electrical / plumbing capex.
- Market conditions: 34 active listings in the ZIP; solid renter incomes; 220 units permitted in Geauga County in 2024 (0 in 5+ unit buildings).
- Geauga County population projected to shrink 7% by 2050 — rents likely to lag national; underwrite the cash flow, not the appreciation.
- Current owner paid $75k; list at $185k implies a 147% gain — meaningful room to come down on a strong offer.
- At projected returns (-3.0% appreciation + 3.0% rent growth), your $52k cash investment doubles in ~6 years — after that, you're playing with house money.
- Cap rate 12.7% vs local median 4.8% in Chesterland — top-decile yield for the area; either an underpriced asset or a hidden risk that comps aren't pricing in. Stress-test before assuming the spread holds.
- This rent runs 32% of the median local income ($107k/yr) — at the standard rent-burdened threshold; future hikes will face affordability resistance.
Questions for listing agent
- It's been on market 54 days. Have you received any prior offers? Is the seller open to a 3% concession, seller financing, or rate buy-down credit?
- Built in 1952 — when were the roof, HVAC, electrical panel, plumbing, and water heater last replaced?
- Is there a deadline driving the sale (1031 exchange, divorce, estate, relocation)? That informs how much negotiation room exists.
- Schools are A-rated — typically a magnet for longer-tenancy family renters. What's the average tenant stay here, and is there a school-zone premium baked into asking?
- What's the average days-on-market for RENTAL listings here right now (not sales)? A rising rental-DOM trend means longer vacancies and softer asking-rent achievability than the comps imply.
- What's the recent tenant-quality profile in this submarket — average credit score on applications, eviction rate, late-payment / NSF rate, and stable-employment percentage? A property-management company in the area should have these aggregated.
- How much new for-sale + rental construction is in the pipeline within 1–3 miles? Heavy new supply typically softens prices + rents 12–24 months out; constrained supply supports both.
CashFlowRE · CFR-GK9AZC4SGMFHJ5
· Data 2 weeks ago
cashflowre.app · 2026-05-29