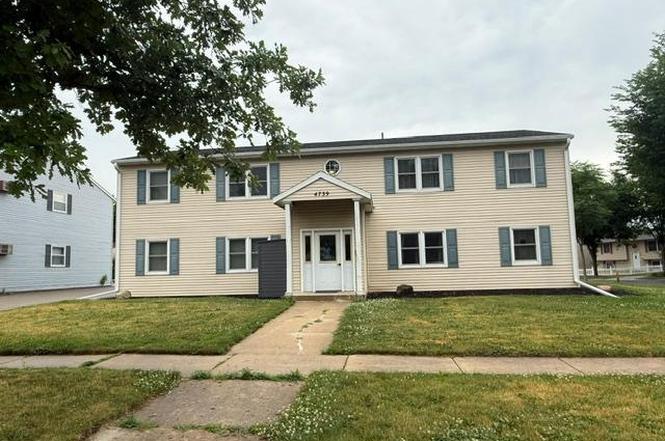
4739 14th Ave NW
Rochester, MN 55901
$469,900C
8 bd · 4.0 ba ·
1,792 sqft ·
Built 1983
· MultiFamily
· Pending
· 3 DOM
Cashflow @ list (25.0% down · 7.5%)
Estimated rent
$5,132/mo
Mortgage (P&I)
−$2,464
Tax + insurance
−$697
HOA
−$0
Vac / Maint / Mgmt
−$1,078
Net cashflow
$893/mo
Annual
$10,721/yr
Cap rate
8.57%
Cash-on-cash
8.15%
DSCR
1.36
1% rule
1.09%
Cash to close
$131,572
Investor read
- This is a 4 × 2-bed/1.0-bath units multifamily listed at $470k.
- At list price, monthly cash flow is $893 ($11k/yr) — positive. Per door: $223/mo.
- The deal already cash-flows at list — no discount required.
- Meets the 1% rule at list price ($5k rent vs $470k).
- Only 3 days on market — expect competitive offers; lowballing is unlikely to land.
- Local home prices are declining (-3.0%/yr); year-one equity from $3k of loan paydown is wiped out by about $14k of value loss. Plan a longer hold.
- Location reads 92/100 on livability (#1 in MN, #27 nationally) — a professional / high-income tenant draw. Strengths: amenities A+, commute A+, employment A+.
- Rochester Public School District (urban): math 40% / reading 51% proficiency, ranked #152 of 301 in MN (top 50%) — families likely to look elsewhere, expect single-tenant / working-renter base with shorter leases.
- Zoned schools: Gage Elementary (math 24% / reading 32%, grade F, #702 of 857 statewide, top 82%, 581 students, 63% FRL); John Adams Middle (math 20% / reading 42%, grade F, #191 of 258 statewide, top 74%, 731 students, 42% FRL); John Marshall Senior High (math 37% / reading 58%, grade D, #162 of 471 statewide, top 35%, 1,573 students, 43% FRL) — zoned schools average 49% FRL vs 31% district-wide (19 pts higher); higher-poverty schools than district average — tighter screening recommended.
- Market conditions: Rents rising (+2.2%/yr); 507 active listings in the ZIP; solid renter incomes; 1,267 units permitted in Olmsted County in 2024 (915 in 5+ unit buildings).
- Olmsted County population projected at +16% by 2050 — long-run rental-demand tailwind backs the buy-and-hold thesis.
- 3 sale attempts since 19y ago with the ask held roughly flat each time — persistent listings suggest the price (not the market) is what's stuck; bring a comps-based counter.
- Current owner paid $339k; 39% above their basis — modest negotiation headroom, anchor on the comps not their cost.
- Cap rate 8.6% vs local median 3.6% in Rochester — top-decile yield for the area; either an underpriced asset or a hidden risk that comps aren't pricing in. Stress-test before assuming the spread holds.
- At $5,132/mo this rent would consume 65% of the median local household income ($95k/yr) (locally 1651% of renters already pay >50% of income on rent) — very limited rent-growth headroom before tenants either downsize or default.
Questions for listing agent
- Can we see the unit-by-unit rent roll, current vacancy, and any below-market leases? What's the average tenancy length?
- What capital expenditures (roof, boiler, parking lot, exteriors) have been made in the last 5 years, and what's planned in the next 2?
- Is there a deadline driving the sale (1031 exchange, divorce, estate, relocation)? That informs how much negotiation room exists.
- Schools are A-rated — typically a magnet for longer-tenancy family renters. What's the average tenant stay here, and is there a school-zone premium baked into asking?
- What's the average days-on-market for RENTAL listings here right now (not sales)? A rising rental-DOM trend means longer vacancies and softer asking-rent achievability than the comps imply.
- What's the recent tenant-quality profile in this submarket — average credit score on applications, eviction rate, late-payment / NSF rate, and stable-employment percentage? A property-management company in the area should have these aggregated.
- How much new apartment / multifamily construction is in the pipeline within 1–3 miles? Heavy new supply (>2% of stock underway) typically softens rents 12–24 months out; light construction supports rent growth.
CashFlowRE · CFR-GKQZ1736TR72EQ
· Data 1 day ago
cashflowre.app · 2026-05-29