 Fourplex
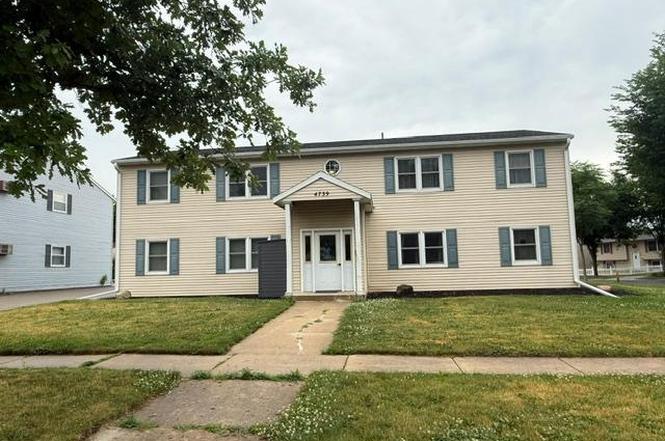
4739 14th Ave NW · Rochester, MN
Flood risk 1/10 · Minimal
- FEMA flood zone
- X (unshaded)
- Chance of flooding over 30 yrs
- 0.0%
- Est. flood insurance / yr
- $507 – $1,088
Fire risk 1/10 · Minimal
- Est. fire insurance / yr
- $888 – $1,650
Heat risk 2/10 · Minimal
- Hot days now (above 99°F)
- 7 days/yr
- Hot days in 30 yrs
- 15 days/yr
Wind risk 2/10 · Minimal
- Chance of severe wind over 30 yrs
- —
Air-quality risk 2/10 · Minimal
- Unhealthy air days now
- 1 days/yr
- Unhealthy air days in 30 yrs
- 1 days/yr
Risk factors via First Street. Map © Google.
Why this score? — see what drove the C grade
The composite is a weighted blend of 9 inputs, each scored 0–100. Each bar is that input's sub-score; the figure is the points it added to the 100-point composite (weight × sub-score).
- Cash flow +23.7/30.0
- DSCR +7.6/10.0
- ARV discount +7.5/15.0
- 1% rule +5.9/10.0
- Livability +4.6/5.0
- Schools +4.1/10.0
- Rent growth +3.0/5.0
- Condition / age +2.5/5.0
- Appreciation +0.0/10.0
$469,900
🖨 Deal sheet (PDF) 📄 Offer letter ✓ Due diligence
Multi-family units
County records classify this as Multi-Family (5+ Unit). Listing-text estimate: 4 units. estimate disagrees with records
5+ unit building — per-unit beds/baths from public records are typically unavailable; the breakdown below (if shown) is an estimate from the listing text.
Listing remarks
Fully occupied 4-Plex in a great NW residential location. Four larger 2 bedroom units. Tenants pay heat / electric. Shingles, windows, siding all replaced in 2019.
Key facts
- 9,147 sq ft lot
- 4 parking spots
- Built 1983
Tags
Property features AI
Finance
- Other: Standard rental license in place
- Financial info: 4 total units; Gross income: $41,766; Net operating income: $25,272; Owner pays water, sewer and trash collection; Tenant pays electricity and heat; Annual fuel expense: $359; Annual water/sewer expense: $1,500; Annual trash expense: $1,288; Annual electric expense: $1,259; Annual insurance expense: $5,734; Other annual expenses: $1,550
- HOA & community: Coin-op laundry owned (association amenity)
Exterior
- Parking: Parking lot; Assigned parking spaces per unit (1 per unit)
- Utilities: City water connected; City sewer connected; Natural gas; 150 amp electric service
- Home design: Residential income property; Two levels; Above-grade finished area: 3,584 square feet; Main level finished area: 1,792 square feet
- Construction: Frame construction; Built/roof age 8 years or less; Slab foundation
- Exterior features: Vinyl exterior; Corner lot
Interior
- Kitchen: Each unit includes a range, refrigerator, microwave and dishwasher
- Bedrooms: 8 bedrooms total across the property (unit breakdowns include 2-bed units)
- Bathrooms: Full bathrooms in each unit (each unit has 1 full bath)
- Heating & cooling: Hot water heating; Wall-mounted cooling units in individual units
- Interior features: Common area laundry; No basement; Hot water heating
- Laundry & utility: Coin-operated laundry owned (building amenity); Common area laundry
Neighborhood map
What this means for you Summary
Snapshot
- This is a 4 × 2-bed/1.0-bath units multifamily listed at $470k.
Deal economics
- At list price, monthly cash flow is $893 ($11k/yr) — positive. Per door: $223/mo.
- The deal already cash-flows at list — no discount required.
- Meets the 1% rule at list price ($5k rent vs $470k).
- Cap rate 8.6% vs local median 3.6% in Rochester — top-decile yield for the area; either an underpriced asset or a hidden risk that comps aren't pricing in. Stress-test before assuming the spread holds.
Location & tenants
- Location reads 92/100 on livability (#1 in MN, #27 nationally) — a professional / high-income tenant draw. Strengths: amenities A+, commute A+, employment A+.
- Rochester Public School District (urban): math 40% / reading 51% proficiency, ranked #152 of 301 in MN (top 50%) — families likely to look elsewhere, expect single-tenant / working-renter base with shorter leases.
- Zoned schools: Gage Elementary (math 24% / reading 32%, grade F, #702 of 857 statewide, top 82%, 581 students, 63% FRL); John Adams Middle (math 20% / reading 42%, grade F, #191 of 258 statewide, top 74%, 731 students, 42% FRL); John Marshall Senior High (math 37% / reading 58%, grade D, #162 of 471 statewide, top 35%, 1,573 students, 43% FRL) — zoned schools average 49% FRL vs 31% district-wide (19 pts higher); higher-poverty schools than district average — tighter screening recommended.
- Market conditions: Rents rising (+2.2%/yr); 507 active listings in the ZIP; solid renter incomes; 1,267 units permitted in Olmsted County in 2024 (915 in 5+ unit buildings).
- At $5,132/mo this rent would consume 65% of the median local household income ($95k/yr) (locally 1651% of renters already pay >50% of income on rent) — very limited rent-growth headroom before tenants either downsize or default.
Forward outlook
- Local home prices are declining (-3.0%/yr); year-one equity from $3k of loan paydown is wiped out by about $14k of value loss. Plan a longer hold.
- Olmsted County population projected at +16% by 2050 — long-run rental-demand tailwind backs the buy-and-hold thesis.
Negotiation context
- Only 3 days on market — expect competitive offers; lowballing is unlikely to land.
- 3 sale attempts since 19y ago with the ask held roughly flat each time — persistent listings suggest the price (not the market) is what's stuck; bring a comps-based counter.
- Current owner paid $339k; 39% above their basis — modest negotiation headroom, anchor on the comps not their cost.
Questions for the listing agent
- Can we see the unit-by-unit rent roll, current vacancy, and any below-market leases? What's the average tenancy length?
- What capital expenditures (roof, boiler, parking lot, exteriors) have been made in the last 5 years, and what's planned in the next 2?
- Is there a deadline driving the sale (1031 exchange, divorce, estate, relocation)? That informs how much negotiation room exists.
- Schools are A-rated — typically a magnet for longer-tenancy family renters. What's the average tenant stay here, and is there a school-zone premium baked into asking?
- What's the average days-on-market for RENTAL listings here right now (not sales)? A rising rental-DOM trend means longer vacancies and softer asking-rent achievability than the comps imply.
- What's the recent tenant-quality profile in this submarket — average credit score on applications, eviction rate, late-payment / NSF rate, and stable-employment percentage? A property-management company in the area should have these aggregated.
- How much new apartment / multifamily construction is in the pipeline within 1–3 miles? Heavy new supply (>2% of stock underway) typically softens rents 12–24 months out; light construction supports rent growth.
Investment metrics
- 1% rule
- 1.09% ✓
- Cap rate
- 8.57%
- Cash-on-cash
- 8.15%
- DSCR
- 1.36
- GRM
- 7.6
CMA / ARV
No comps found within radius.
Projected returns pro-forma
-3.0% appreciation · 2.18% rent growth · sell at horizon
- IRR
- -4.8%
- Equity multiple
- 0.82×
- Total profit
- $-23,416
- Equity at exit
- $70,064
- IRR
- 3.9%
- Equity multiple
- 1.27×
- Total profit
- $36,030
- Equity at exit
- $40,628
Cash invested: $131,572 (down + closing). Projections, not guarantees.
Landlord ↔ Tenant lean methodology
- Overall (STATE)
- 46 Balanced
- State Minnesota
- 46 Balanced · D+2
- County
- — inherits STATE
- City
- — inherits STATE
ZIP-level market 55901
- Home prices YoY
- -33.2%
- Rents YoY
- 2.2%
- Active inventory
- 507
- Price-to-rent
- 30.5×
Monthly cashflow live
- Estimated rent
- $5,132 medium interval (Pro) →
- Mortgage (P&I)
- −$2,464
- Tax from tax record
- −$501 /mo · $6,010/yr
- Insurance
- −$196
- HOA
- −$0
- Vacancy / Maint / Mgmt
- −$1,078
- Net cashflow
- $893
Break-even live
Sensitivity live
| Price | -10% $1,159 | -5% $1,026 | +0% $893 | +5% $760 | +10% $627 |
|---|---|---|---|---|---|
| Rent | -10% $488 | -5% $691 | +0% $893 | +5% $1,096 | +10% $1,299 |
| Rate | -1.0pp $1,130 | -0.5pp $1,013 | base $893 | +0.5pp $772 | +1.0pp $648 |
4-unit breakdown (identical units grouped — click to expand)
| Units | Beds | Baths | Est. rent |
|---|---|---|---|
| 4× units | 2 | 1 | $5,132 |
| #1 | 2 | 1 | $1,283 |
| #2 | 2 | 1 | $1,283 |
| #3 | 2 | 1 | $1,283 |
| #4 | 2 | 1 | $1,283 |
| Total (4 units) | $5,132 | ||
UW: 25.0% down · 7.5% · 30yr · 1.5% tax · 5.0% vac · 8.0% maint · 8.0% mgmt
Financing live
Cash to close
- Down payment
- $117,475
- Closing costs
- $14,097
- Reserves months
- —
- Total cash needed
- —
Loan-product check · same deal, 3 products live
Conventional
25% down · 7.5% · 30yr
- Down + closing
- —
- Monthly P&I
- —
- Monthly cashflow
- —
- DSCR
- —
- Eligible?
- —
Personal DTI + credit; lowest rate.
DSCR
20% down · 8.5% · 30yr
- Down + closing
- —
- Monthly P&I
- —
- Monthly cashflow
- —
- DSCR
- —
- Eligible?
- —
No personal income docs; deal must DSCR.
Hard money
10% down · 12.0% · 12mo
- Down + closing
- —
- Monthly P&I
- —
- Monthly cashflow
- —
- DSCR
- —
- Eligible?
- —
Short-term bridge; refi at stabilization.
Listing history 5 events
-
2026-06-21status $469,900 Pending 3 DOM
-
2026-06-19days on market $469,900 Active 3 DOM
-
2026-06-18days on market $469,900 Active 2 DOM
-
2026-06-16remarks 164-char remark
-
2026-06-16$469,900 Active 1 DOM
ⓘ Source: listings_history table (triggers on properties + properties_extension) + one-shot
backfill from property_details.listing_events for pre-trigger history.
Tax reassessment forecast MN · Partial reset (capped growth)
- Current annual tax
- $6,010 · $501/mo
- Projected year-2 tax
- $6,010 · $501/mo
- Expected delta
- $0/yr ($0/mo · 0.0%)
ⓘ Screening estimate from a state-policy table — verify with the county assessor before closing.
Climate risk First Street
- Flood 1/10 Low FEMA zone X (unshaded) · 0% chance over 30 yrs
- Wildfire 1/10 Low
- Heat 2/10 Low 7 d/yr ≥99°F today · 15 d/yr by 30 yrs out
- Wind 2/10 Low
- Air quality 2/10 Low 1 unhealthy d/yr today · 1 by 30 yrs out
Nearby sold comps map
Loading sold comps map…
Walkable amenities ~0.75 mi
Loading nearby amenities…
Taxation est. · year 1
- Rental income
- $61,584
- − Mortgage interest
- −$26,322
- − Property taxes
- −$6,010
- − Insurance
- −$2,350
- − Repairs & maintenance
- −$4,927
- − Management
- −$4,927
- − Depreciation
- −$13,670
- Taxable income
- $3,380
- Est. tax owed @ 24.0%
- −$811
- After-tax cash flow
- $9,910/yr
For passive investors: Depreciation is non-cash, so a rental often shows a tax loss while cash-flowing — sheltering income. Rental losses are passive: they offset passive income freely, and up to $25,000/yr can offset ordinary (W-2) income if you actively participate and your MAGI is under $100k (phasing out to $0 by $150k); unused losses carry forward. On sale, claimed depreciation is recaptured at up to 25%, and gains may owe capital-gains tax (a 1031 exchange can defer both). Figures are a year-1 estimate at your 24.0% rate — not tax advice; consult a CPA.
Schools (NCES district)
- District
- Rochester Public School District
- NCES district ID
- 2731800
- Math proficiency
- 40% ▼ -10.00%
- Reading proficiency
- 51% ▼ -4.00%
- Median HH income
- $66,540
- Composite
- 40.6/100
- National rank
- #3695
- State rank
- #152 of 301 in MN
Livability — Rochester
- Score
- 92/100
- State rank
- #1
- US rank
- #27
Category grades
Schools grade is shown separately in the Schools card above.
Census & demographics
- Census place
- Rochester, MN
- County
- Olmsted County · 135,035 people
- City population
- 135,035
- Metro
- Rochester, MN
- Population (ZIP)
- 58,495
- Household income
- $94,607
- Rent vs Own
- Severe rent burden
- 1651.0
Population outlook (Olmsted County) Hauer SSP2
- Today (2025)
- 165,999 people
- By 2030
- 172,425 · +3.9%
- By 2040
- 183,785 · +10.7%
- By 2050
- 192,981 · +16.3%
- By 2075
- 215,284 · +29.7%
- By 2100
- 224,887 · +35.5%
Race, ethnicity, and origin ACS 2023
- Neighborhood character
- Predominantly White (71%)
- Race & ethnicity
- White 71% Black 12% Asian 8% Two or more races 6% Hispanic / Latino 5%
- Hispanic origin (detail)
- Mexican 3%
- Common ancestry
- Portuguese 11% Romanian 3% Iranian 2%
- Foreign-born
- 15% · Canada, Vietnam, China
- Languages at home
- 81% English-only · Spanish 3% Other Asian/Pacific 3% Arabic 2%
Political lean MEDSL · Olmsted
- 2024 margin
- D (+10.7) · D 54.3% · R 43.6% · Other 2.1%
- 2008→2024 swing
- +7.4pp toward D · 2008: 3.3pp · 2024: 10.7pp
- All cycles
- 2024: D+10.7 2020: D+10.7 2016: D+0.8 2012: D+3.2 2008: D+3.3
Not yet ingested
- Civics
- —
Market trends
- HPI YoY
- ▼ -126.08%
- Current HPI
- 253.7999
- Rent YoY
- ▲ 2.18%
- Metro
- Rochester, MN
- State GDP YoY
- ▲ 2.41%
- F500 in state
- 34
Industry mix (Fortune 500 HQ in MN)
| Industry | F500 HQs | Revenue |
|---|---|---|
| Healthcare | 2 | $407B |
|
||
| Retail | 2 | $150B |
|
||
| Consumer Goods | 2 | $32B |
|
||
| Industrial Machinery | 2 | $6B |
|
||
| Agriculture | 1 | $40B |
|
||
| Healthcare / Medical Devices | 1 | $32B |
|
||
Price history
+1077.7% since first listed9 events — show timeline
- 2026-06-16 Listed $469,900 NORTHSTARMLS as Distributed by MLS Grid
- 2020-02-26 Sold (Public Records) $339,000 Public Records
- 2007-03-30 Listed $255,000 NORTHSTARMLS as Distributed by MLS Grid
- 2007-03-30 Listed $255,000 NORTHSTARMLS as Distributed by MLS Grid
- 1996-12-03 Sold (Public Records) $100,000 Public Records
- 1995-12-01 Sold (Public Records) $100,000 Public Records
- 1994-03-01 Sold (Public Records) $167,500 Public Records
- 1982-12-01 Sold (Public Records) $14,000 Public Records
- 1982-10-01 Sold (Public Records) $39,900 Public Records
Property tax history
+5.4%/yrLatest (2025): $6,010 · +16.5% YoY. Source: county tax records.
Cash-flow waterfall
monthlySold comps — $/sqft
last 12 mo · ≤1 miLoading sold comps…