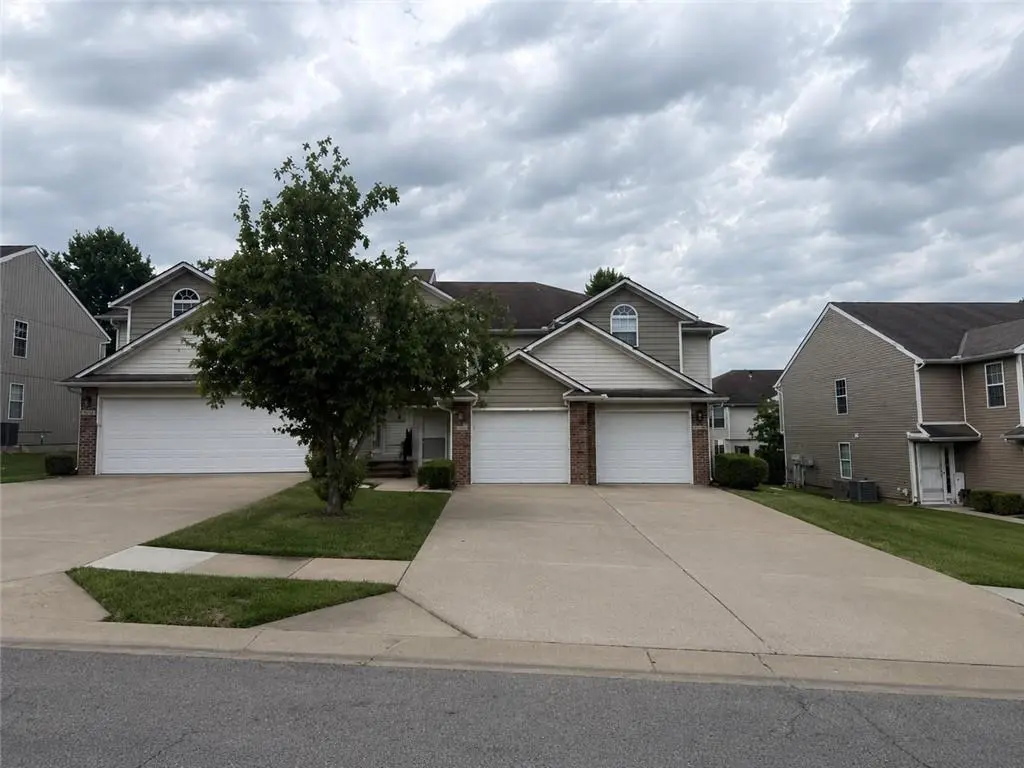
10549 E 46th St
Kansas City, MO 64133
$679,000D-
10 bd · 10.0 ba ·
5,214 sqft ·
Built 2007
· MultiFamily
· Active
· 1 DOM
Cashflow @ list (25.0% down · 7.5%)
Estimated rent
$6,394/mo
Mortgage (P&I)
−$3,561
Tax + insurance
−$986
HOA
−$720
Vac / Maint / Mgmt
−$1,343
Net cashflow
$-215/mo
Annual
$-2,580/yr
Cap rate
5.91%
Cash-on-cash
-1.36%
DSCR
0.94
1% rule
0.94%
Cash to close
$190,120
Investor read
- This is a 2×3bd/2.5ba + 2×2bd/2.5ba units multifamily listed at $679k.
- At list price, monthly cash flow is $-215 ($-3k/yr) — negative. Per door: $-54/mo.
- To cash-flow at today's rent, offer at most $641k (5.6% below list).
- To meet the 1% rule (rent ≥ 1% of price), the offer needs to be $639k (5.8% below list).
- Only 1 days on market — expect competitive offers; lowballing is unlikely to land.
- Recommended offer: $639k (5.8% below list) — sets the bar for 1% rule.
- Local home prices are declining (-3.0%/yr); year-one equity from $5k of loan paydown is wiped out by about $20k of value loss. Plan a longer hold.
- Location reads 78/100 on livability (#28 in MO, #2,671 nationally) — a middle-class / working-renter tenant base. Strengths: amenities A+, commute A+, cost of living A+; Watch: schools C-, crime F.
- Raytown C-2 (suburban): math 12% / reading 28% proficiency, ranked #302 of 324 in MO (top 93%) — low school quality limits family demand, transient renter base, plan for 1-2y turnover.
- Market conditions: Rents rising (+1.3%/yr); 203 active listings in the ZIP; 4,002 units permitted in Jackson County in 2024 (2,271 in 5+ unit buildings).
- Jackson County population projected at +4% by 2050 — modest demand growth; plan on rents tracking national, not racing it.
- 3 sale attempts since 8y ago with the ask held roughly flat each time — persistent listings suggest the price (not the market) is what's stuck; bring a comps-based counter.
- Cap rate 5.9% vs local median 3.9% in Kansas City — top-decile yield for the area; either an underpriced asset or a hidden risk that comps aren't pricing in. Stress-test before assuming the spread holds.
- At $6,394/mo this rent would consume 113% of the median local household income ($68k/yr) (locally 1173% of renters already pay >50% of income on rent) — very limited rent-growth headroom before tenants either downsize or default.
Questions for listing agent
- What do current leases actually rent for vs. the listed asking? Can we see a recent rent roll and the last 12 months of T-12 income?
- Can we see the unit-by-unit rent roll, current vacancy, and any below-market leases? What's the average tenancy length?
- What capital expenditures (roof, boiler, parking lot, exteriors) have been made in the last 5 years, and what's planned in the next 2?
- What does the HOA fee cover, when was the last increase, and are there any pending special assessments or reserve-fund shortfalls?
- Is there a deadline driving the sale (1031 exchange, divorce, estate, relocation)? That informs how much negotiation room exists.
- Crime grade is F in this area — have there been break-ins, vandalism, or insurance claims at this property in the last 3 years? What carrier currently insures it and at what premium?
- The area grade is low — what's the realistic commute time and amenity access for the typical tenant pool here? Any planned neighborhood developments (good or bad) we should know about?
- What's the average days-on-market for RENTAL listings here right now (not sales)? A rising rental-DOM trend means longer vacancies and softer asking-rent achievability than the comps imply.
CashFlowRE · CFR-GMBE6M5SYQRVMB
· Data 2 days ago
cashflowre.app · 2026-05-29