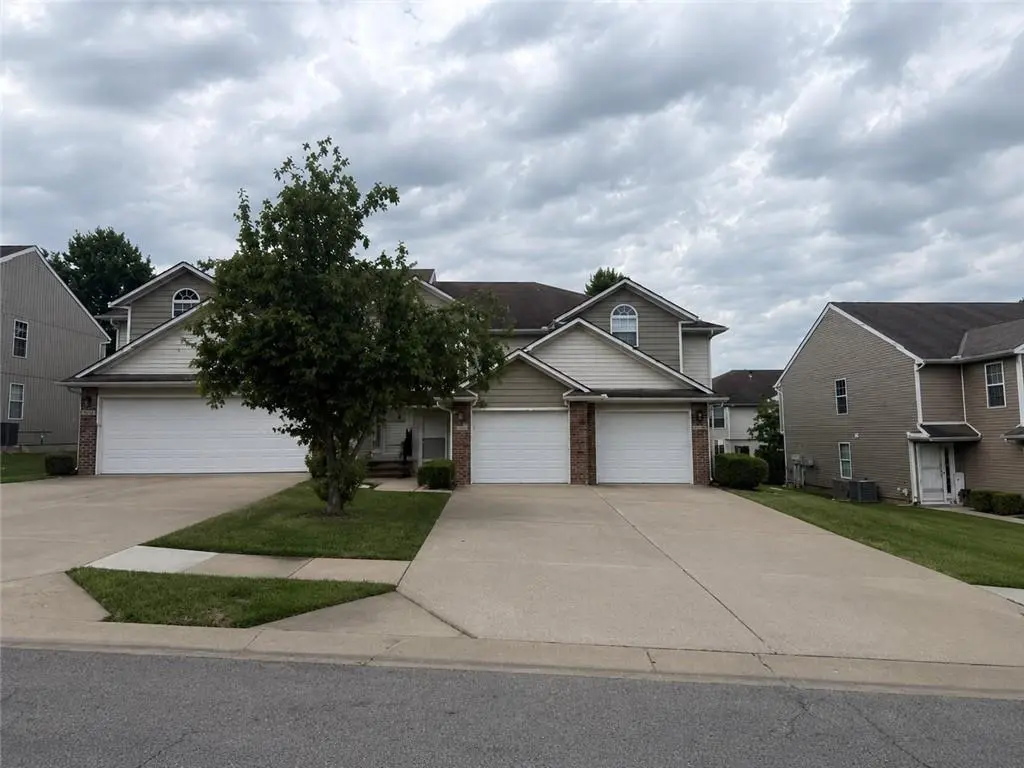
 Fourplex
10549 E 46th St · Kansas City, MO
Flood risk 1/10 · Minimal
- FEMA flood zone
- X (unshaded)
- Chance of flooding over 30 yrs
- 0.0%
- Est. flood insurance / yr
- $507 – $1,088
Fire risk 2/10 · Minimal
- Est. fire insurance / yr
- $1,054 – $1,958
Heat risk 4/10 · Minor
- Hot days now (above 106°F)
- 7 days/yr
- Hot days in 30 yrs
- 17 days/yr
Wind risk 2/10 · Minimal
- Chance of severe wind over 30 yrs
- —
Air-quality risk 3/10 · Minor
- Unhealthy air days now
- 3 days/yr
- Unhealthy air days in 30 yrs
- 5 days/yr
Risk factors via First Street. Map © Google.
Why this score? — see what drove the D- grade
The composite is a weighted blend of 9 inputs, each scored 0–100. Each bar is that input's sub-score; the figure is the points it added to the 100-point composite (weight × sub-score).
- Cash flow +11.6/30.0
- ARV discount +7.5/15.0
- 1% rule +4.4/10.0
- Livability +3.9/5.0
- DSCR +3.4/10.0
- Rent growth +2.8/5.0
- Condition / age +2.5/5.0
- Schools +1.8/10.0
- Appreciation +0.0/10.0
$679,000
🖨 Deal sheet 📄 Offer letter ✓ Due diligence
Multi-family units
County records classify this as Multi-Family (2-4 Unit). Listing-text estimate: 4 units. confirmed
Listing remarks MLS
Sold Before process
Key facts
- New hvac and a/c
- Fully occupied
- Strong rental income
Tags
Property features AI
Finance
- Other: Lot size approximately 11,105 square feet
- Financial info: Gross income reported at $67,992; Operating expenses include real estate tax
- HOA & community: Homeowner association present; Association fee approximately $720; HOA provides exterior building and lawn maintenance
Exterior
- Parking: Attached garage available
- Utilities: City/public water (verify); Public sewer; Individual heat and air; Individual water heaters
- Home design: Residential income property (quadruplex); Two-story building; Approximately 16–20 years old
- Construction: Vinyl siding; Composition roof
- Exterior features: Building exterior and lawn maintenance provided by association; Not located in a flood plain
Interior
- Kitchen: No specific appliances listed
- Bedrooms: Units include 2-bedroom and 3-bedroom layouts; Some units are 4+ bedroom type listed in unit types
- Bathrooms: Units include full and half bathrooms (configurations vary by unit type)
- Heating & cooling: Forced air heating; Electric cooling
- Interior features: Individual heating and air systems for units; Individual water heaters
- Laundry & utility: Individual utility setups for each unit
Neighborhood map
What this means for you Summary
Snapshot
- This is a 2×3bd/2.5ba + 2×2bd/2.5ba units multifamily listed at $679k.
Deal economics
- At list price, monthly cash flow is $-215 ($-3k/yr) — negative. Per door: $-54/mo.
- To cash-flow at today's rent, offer at most $641k (5.6% below list).
- To meet the 1% rule (rent ≥ 1% of price), the offer needs to be $639k (5.8% below list).
- Recommended offer: $639k (5.8% below list) — sets the bar for 1% rule.
- Cap rate 5.9% vs local median 3.9% in Kansas City — top-decile yield for the area; either an underpriced asset or a hidden risk that comps aren't pricing in. Stress-test before assuming the spread holds.
Location & tenants
- Location reads 78/100 on livability (#28 in MO, #2,671 nationally) — a middle-class / working-renter tenant base. Strengths: amenities A+, commute A+, cost of living A+; Watch: schools C-, crime F.
- Raytown C-2 (suburban): math 12% / reading 28% proficiency, ranked #302 of 324 in MO (top 93%) — low school quality limits family demand, transient renter base, plan for 1-2y turnover.
- Market conditions: Rents rising (+1.3%/yr); 203 active listings in the ZIP; 4,002 units permitted in Jackson County in 2024 (2,271 in 5+ unit buildings).
- At $6,394/mo this rent would consume 113% of the median local household income ($68k/yr) (locally 1173% of renters already pay >50% of income on rent) — very limited rent-growth headroom before tenants either downsize or default.
Forward outlook
- Local home prices are declining (-3.0%/yr); year-one equity from $5k of loan paydown is wiped out by about $20k of value loss. Plan a longer hold.
- Jackson County population projected at +4% by 2050 — modest demand growth; plan on rents tracking national, not racing it.
Negotiation context
- Only 1 days on market — expect competitive offers; lowballing is unlikely to land.
- 3 sale attempts since 8y ago with the ask held roughly flat each time — persistent listings suggest the price (not the market) is what's stuck; bring a comps-based counter.
Questions for the listing agent
- What do current leases actually rent for vs. the listed asking? Can we see a recent rent roll and the last 12 months of T-12 income?
- Can we see the unit-by-unit rent roll, current vacancy, and any below-market leases? What's the average tenancy length?
- What capital expenditures (roof, boiler, parking lot, exteriors) have been made in the last 5 years, and what's planned in the next 2?
- What does the HOA fee cover, when was the last increase, and are there any pending special assessments or reserve-fund shortfalls?
- Is there a deadline driving the sale (1031 exchange, divorce, estate, relocation)? That informs how much negotiation room exists.
- Crime grade is F in this area — have there been break-ins, vandalism, or insurance claims at this property in the last 3 years? What carrier currently insures it and at what premium?
- The area grade is low — what's the realistic commute time and amenity access for the typical tenant pool here? Any planned neighborhood developments (good or bad) we should know about?
- What's the average days-on-market for RENTAL listings here right now (not sales)? A rising rental-DOM trend means longer vacancies and softer asking-rent achievability than the comps imply.
- What's the recent tenant-quality profile in this submarket — average credit score on applications, eviction rate, late-payment / NSF rate, and stable-employment percentage? A property-management company in the area should have these aggregated.
- How much new apartment / multifamily construction is in the pipeline within 1–3 miles? Heavy new supply (>2% of stock underway) typically softens rents 12–24 months out; light construction supports rent growth.
Investment metrics
- 1% rule
- 0.94% ✗
- Cap rate
- 5.91%
- Cash-on-cash
- -1.36%
- DSCR
- 0.94
- GRM
- 8.8
CMA / ARV
No comps found within radius.
Projected returns pro-forma
-3.0% appreciation · 1.34% rent growth · sell at horizon
- IRR
- -20.6%
- Equity multiple
- 0.30×
- Total profit
- $-133,778
- Equity at exit
- $101,241
- IRR
- -18.4%
- Equity multiple
- 0.08×
- Total profit
- $-173,996
- Equity at exit
- $58,708
Cash invested: $190,120 (down + closing). Projections, not guarantees.
Landlord ↔ Tenant lean methodology
- Overall (STATE)
- 81 Strongly Landlord-Friendly
- State Missouri
- 81 Strongly Landlord-Friendly · R+10
- County
- — inherits STATE
- City
- — inherits STATE
ZIP-level market 64133
- Rents YoY
- 1.3%
- Active inventory
- 203
- Price-to-rent
- 34.5×
Monthly cashflow live
- Estimated rent
- $6,394 high interval (Pro) →
- Mortgage (P&I)
- −$3,561
- Tax from tax record
- −$703 /mo · $8,431/yr
- Insurance
- −$283
- HOA
- −$720
- Vacancy / Maint / Mgmt
- −$1,343
- Net cashflow
- $-215
Break-even live
4-unit breakdown (identical units grouped — click to expand)
| Units | Beds | Baths | Est. rent |
|---|---|---|---|
| 2× units | 3 | 2.5 | $3,280 |
| #1 | 3 | 2.5 | $1,640 |
| #2 | 3 | 2.5 | $1,640 |
| 2× units | 2 | 2.5 | $3,114 |
| #3 | 2 | 2.5 | $1,557 |
| #4 | 2 | 2.5 | $1,557 |
| Total (4 units) | $6,394 | ||
UW: 25.0% down · 7.5% · 30yr · 1.5% tax · 5.0% vac · 8.0% maint · 8.0% mgmt
Financing live
Cash to close
- Down payment
- $169,750
- Closing costs
- $20,370
- Reserves months
- —
- Total cash needed
- —
Loan-product check · same deal, 3 products live
Conventional
25% down · 7.5% · 30yr
- Down + closing
- —
- Monthly P&I
- —
- Monthly cashflow
- —
- DSCR
- —
- Eligible?
- —
Personal DTI + credit; lowest rate.
DSCR
20% down · 8.5% · 30yr
- Down + closing
- —
- Monthly P&I
- —
- Monthly cashflow
- —
- DSCR
- —
- Eligible?
- —
No personal income docs; deal must DSCR.
Hard money
10% down · 12.0% · 12mo
- Down + closing
- —
- Monthly P&I
- —
- Monthly cashflow
- —
- DSCR
- —
- Eligible?
- —
Short-term bridge; refi at stabilization.
HOA detail
- Monthly dues
- $720 · $8,640/yr
Listing history 2 events
-
2026-06-17remarks 699-char remark
-
2026-06-17$679,000 Active 1 DOM
ⓘ Source: listings_history table (triggers on properties + properties_extension) + one-shot
backfill from property_details.listing_events for pre-trigger history.
Tax reassessment forecast MO · Resets to sale price
- Current annual tax
- $8,431 · $703/mo
- Projected year-2 tax
- $8,431 · $703/mo
- Expected delta
- $0/yr ($0/mo · 0.0%)
ⓘ Screening estimate from a state-policy table — verify with the county assessor before closing.
Climate risk First Street
- Flood 1/10 Low FEMA zone X (unshaded) · 0% chance over 30 yrs
- Wildfire 2/10 Low
- Heat 4/10 Moderate 7 d/yr ≥106°F today · 17 d/yr by 30 yrs out
- Wind 2/10 Low
- Air quality 3/10 Moderate 3 unhealthy d/yr today · 5 by 30 yrs out
Nearby sold comps map
Loading sold comps map…
Walkable amenities ~0.75 mi
Loading nearby amenities…
Taxation est. · year 1
- Rental income
- $76,728
- − Mortgage interest
- −$38,035
- − Property taxes
- −$8,431
- − Insurance
- −$3,395
- − Repairs & maintenance
- −$6,138
- − Management
- −$6,138
- − HOA
- −$8,640
- − Depreciation
- −$19,753
- Taxable loss
- −$13,802
- Est. tax savings @ 24.0%
- +$3,312
- After-tax cash flow
- $732/yr
For passive investors: Depreciation is non-cash, so a rental often shows a tax loss while cash-flowing — sheltering income. Rental losses are passive: they offset passive income freely, and up to $25,000/yr can offset ordinary (W-2) income if you actively participate and your MAGI is under $100k (phasing out to $0 by $150k); unused losses carry forward. On sale, claimed depreciation is recaptured at up to 25%, and gains may owe capital-gains tax (a 1031 exchange can defer both). Figures are a year-1 estimate at your 24.0% rate — not tax advice; consult a CPA.
Schools (NCES district)
- District
- Raytown C-2
- NCES district ID
- 2926070
- Math proficiency
- 12% ▼ -11.00%
- Reading proficiency
- 28% ▼ -9.00%
- Median HH income
- $47,215
- Composite
- 17.59/100
- National rank
- #9039
- State rank
- #302 of 324 in MO
Livability — Kansas City
- Score
- 78/100
- State rank
- #28
- US rank
- #2671
Category grades
Schools grade is shown separately in the Schools card above.
Census & demographics
- Census place
- Kansas City, MO
- County
- Jackson County · 687,798 people
- City population
- 439,467
- Metro
- Kansas City, MO-KS
- Population (ZIP)
- 36,249
- Household income
- $67,750
- Rent vs Own
- Severe rent burden
- 1173.0
Population outlook (Jackson County) Hauer SSP2
- Today (2025)
- 719,589 people
- By 2030
- 731,456 · +1.6%
- By 2040
- 746,689 · +3.8%
- By 2050
- 749,289 · +4.1%
- By 2075
- 736,227 · +2.3%
- By 2100
- 668,210 · -7.1%
Race, ethnicity, and origin ACS 2023
- Neighborhood character
- Diverse neighborhood (Simpson 0.64)
- Race & ethnicity
- White 46% Black 37% Hispanic / Latino 12% Two or more races 9%
- Hispanic origin (detail)
- Mexican 10%
- Common ancestry
- Italian 7% Slovak 1% Lithuanian 1%
- Foreign-born
- 5% · Canada
- Languages at home
- 90% English-only · Spanish 7% French/Haitian/Cajun 1%
Political lean MEDSL · Jackson
- 2024 margin
- D (+19.3) · D 58.9% · R 39.5% · Other 1.6%
- 2008→2024 swing
- -6.1pp toward R · 2008: 25.4pp · 2024: 19.3pp
- All cycles
- 2024: D+19.3 2020: D+22.0 2016: D+16.6 2012: D+19.0 2008: D+25.4
Not yet ingested
- Civics
- —
Market trends
- HPI YoY
- ▼ -155.40%
- Current HPI
- 263.6915
- Rent YoY
- ▲ 1.34%
- Metro
- Kansas City, MO-KS
- State GDP YoY
- ▲ 1.84%
- F500 in state
- 20
Industry mix (Fortune 500 HQ in MO)
| Industry | F500 HQs | Revenue |
|---|---|---|
| Healthcare | 1 | $163B |
|
||
| Insurance | 1 | $21B |
|
||
| Industrial Technology | 1 | $17B |
|
||
| Retail | 1 | $16B |
|
||
| Industrial Distribution | 1 | $10B |
|
||
| Utilities | 1 | $9B |
|
||
Price history
+94.1% since first listed9 events — show timeline
- 2026-06-17 Listed $679,000 Heartland MLS as Distributed by MLS Grid
- 2026-01-16 Rental Removed $1,495 SHOWMOJO
- 2025-12-04 Price Changed $1,495 SHOWMOJO
- 2025-10-24 Listed for Rent $1,525 SHOWMOJO
- 2018-05-04 Sold (Public Records) — Public Records
- 2018-05-01 Sold (MLS) — Heartland MLS as Distributed by MLS Grid
- 2018-02-21 Listed $349,900 Heartland MLS as Distributed by MLS Grid
- 2006-12-21 Sold (Public Records) — Public Records
- 2006-12-21 Sold (Public Records) — Public Records
Property tax history
+4.7%/yrLatest (2025): $8,431 · +8.9% YoY. Source: county tax records.
Cash-flow waterfall
monthlySold comps — $/sqft
last 12 mo · ≤1 miLoading sold comps…