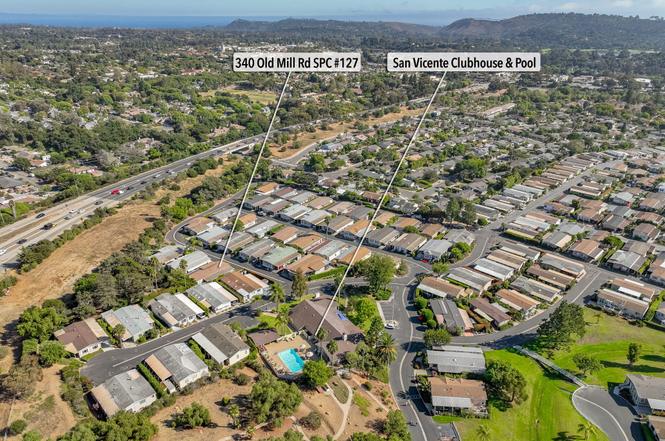
340 Old Ml #127
Eastern Goleta Valley, CA 93110
$475,000C
3 bd · 2.0 ba ·
1,700 sqft ·
Built 1978
· Manufactured
· Active
· 263 DOM
Cashflow @ list (25.0% down · 7.5%)
Estimated rent
$4,823/mo
Mortgage (P&I)
−$2,491
Tax + insurance
−$792
HOA
−$0
Vac / Maint / Mgmt
−$1,013
Net cashflow
$527/mo
Annual
$6,330/yr
Cap rate
7.63%
Cash-on-cash
4.76%
DSCR
1.21
1% rule
1.02%
Cash to close
$133,000
Investor read
- This is a 3-bed/2.0-bath manufactured listed at $475k.
- At list price, monthly cash flow is $527 ($6k/yr) — positive.
- The deal already cash-flows at list — no discount required.
- Meets the 1% rule at list price ($5k rent vs $475k).
- It's been on market 263 days — a 12% lower offer ($418k) is reasonable based on typical stale-listing flexibility.
- Recommended offer: $418k (12.0% below list) — sets the bar for market timing.
- In year one you build about $22k of equity ($3k loan paydown + $19k appreciation (4.0% local appreciation)).
- Location reads: area grade C — affects rentability + tenant quality, not the cash-flow math above.
- Market conditions: 48 active listings in the ZIP; 4 comparable units currently listed for rent nearby; rentals at typical pace (median 15d on market — plan ~3-4 weeks tenant-placement turnaround); high-income renter base; 719 units permitted in Santa Barbara County in 2024 (217 in 5+ unit buildings).
- Santa Barbara County population projected at +20% by 2050 — long-run rental-demand tailwind backs the buy-and-hold thesis.
- 5 sale attempts since 25y ago; this cycle's ask has dropped $74k (13%) from the opening price — seller is motivated, your offer sets the floor, not the list.
- Current owner paid $235k; list at $475k implies a 102% gain — meaningful room to come down on a strong offer.
- At projected returns (4.0% appreciation + 3.0% rent growth), your $133k cash investment doubles in ~5 years — after that, you're playing with house money.
- By year 2, paydown + projected appreciation supports a ~$36k cash-out refi (75% LTV) — recoverable capital for the next deal without selling this one.
- Climate carrying-cost: major wildfire risk; extreme-heat days projected 11→30/yr by 2055 (HVAC capex compounding) — expect insurance premiums to compound above CPI over the hold.
- Cap rate 7.6% vs local median 1.2% in Eastern Goleta Valley — top-decile yield for the area; either an underpriced asset or a hidden risk that comps aren't pricing in. Stress-test before assuming the spread holds.
- This rent runs 45% of the median local income ($129k/yr) — at the standard rent-burdened threshold; future hikes will face affordability resistance.
Questions for listing agent
- It's been on market 263 days. Have you received any prior offers? Is the seller open to a 12% concession, seller financing, or rate buy-down credit?
- Built in 1978 — when were the roof, HVAC, electrical panel, plumbing, and water heater last replaced?
- Why hasn't it sold? Are there any deal-killer items the seller is aware of (foundation, flood, title, zoning, code violations)?
- Is there a deadline driving the sale (1031 exchange, divorce, estate, relocation)? That informs how much negotiation room exists.
- What's the average days-on-market for RENTAL listings here right now (not sales)? A rising rental-DOM trend means longer vacancies and softer asking-rent achievability than the comps imply.
- What's the recent tenant-quality profile in this submarket — average credit score on applications, eviction rate, late-payment / NSF rate, and stable-employment percentage? A property-management company in the area should have these aggregated.
- How much new for-sale + rental construction is in the pipeline within 1–3 miles? Heavy new supply typically softens prices + rents 12–24 months out; constrained supply supports both.
CashFlowRE · CFR-GMNH59CFFRRTB7
· Data 2 days ago
cashflowre.app · 2026-05-29