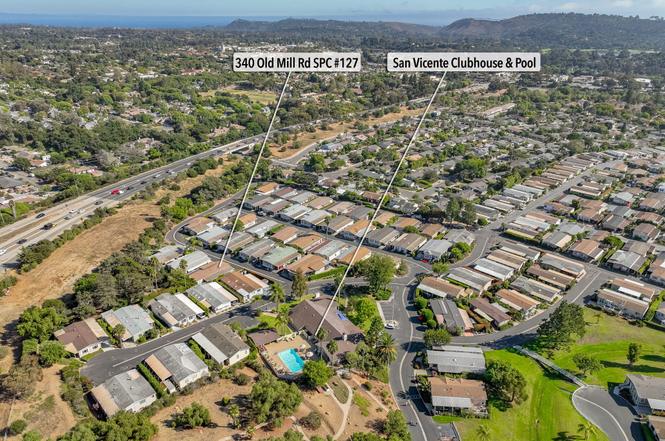
340 Old Ml #127 · Eastern Goleta Valley, CA
Flood risk 1/10 · Minimal
- FEMA flood zone
- X (unshaded)
- Chance of flooding over 30 yrs
- 0.0%
- Est. flood insurance / yr
- $507 – $1,088
Fire risk 6/10 · Moderate
- Est. fire insurance / yr
- $659 – $1,223
Heat risk 7/10 · Major
- Hot days now (above 83°F)
- 11 days/yr
- Hot days in 30 yrs
- 30 days/yr
Wind risk 1/10 · Minimal
- Chance of severe wind over 30 yrs
- —
Air-quality risk 6/10 · Moderate
- Unhealthy air days now
- 10 days/yr
- Unhealthy air days in 30 yrs
- 10 days/yr
Risk factors via First Street. Map © Google.
Why this score? — see what drove the C grade
The composite is a weighted blend of 9 inputs, each scored 0–100. Each bar is that input's sub-score; the figure is the points it added to the 100-point composite (weight × sub-score).
- Cash flow +19.4/30.0
- ARV discount +7.5/15.0
- Appreciation +7.0/10.0
- DSCR +6.1/10.0
- 1% rule +5.2/10.0
- Schools +5.0/10.0
- Rent growth +2.5/5.0
- Livability +2.5/5.0
- Condition / age +2.5/5.0
$475,000
🖨 Deal sheet 📄 Offer letter ✓ Due diligence
Listing remarks MLS
Something totally special- rarely on the market- located on the meadow, triple-wide remodeled home with private redwood deck in this country club style park for 55+. Light & bright on the interior, bonus rooms used for office, study, art studio? Sunroom, master suite with walk-in closet, open&airy floor plan. Kitchen w/an abundance of counter space & storage. Just moments from community amenities.
Key facts
- Garage
- Built 1978
- Listed 263 days
Property features AI
Finance
- Other: Pets allowed with limitations
Exterior
- Parking: Attached garage with inside entrance
- Utilities: Private water system; Sewer hookup
- Home design: Contemporary style; Single story; Fixer condition; Triple-wide manufactured home (Key West); Facing direction not specified; One building
- Construction: Aluminum siding; Composition roof; Pier & post foundation; Mobile home width 24+8, length 64
- Exterior features: Drought-tolerant landscaping; Level lot, greenbelt, near public transit; Mountain and wooded views
Interior
- Kitchen: Refrigerator; Gas range (built-in); Built-in gas oven; Dishwasher; Breakfast bar and breakfast area; Dining area in living room
- Bedrooms: Primary bedroom (ground floor); Ground floor second bedroom; Additional rooms: office, den, family room
- Bathrooms: 2 full bathrooms
- Heating & cooling: Forced air heating
- Interior features: Accessible approach with ramp and accessible bathroom fixtures; Fireplace in family room (gas)
- Laundry & utility: Laundry room with gas hookup
Neighborhood map
What this means for you Summary
Snapshot
- This is a 3-bed/2.0-bath manufactured listed at $475k.
Deal economics
- At list price, monthly cash flow is $527 ($6k/yr) — positive.
- The deal already cash-flows at list — no discount required.
- Meets the 1% rule at list price ($5k rent vs $475k).
- Recommended offer: $418k (12.0% below list) — sets the bar for market timing.
- Cap rate 7.6% vs local median 1.2% in Eastern Goleta Valley — top-decile yield for the area; either an underpriced asset or a hidden risk that comps aren't pricing in. Stress-test before assuming the spread holds.
Location & tenants
- Location reads: area grade C — affects rentability + tenant quality, not the cash-flow math above.
- Market conditions: 48 active listings in the ZIP; 4 comparable units currently listed for rent nearby; rentals at typical pace (median 14d on market — plan ~3-4 weeks tenant-placement turnaround); high-income renter base; 719 units permitted in Santa Barbara County in 2024 (217 in 5+ unit buildings).
- This rent runs 45% of the median local income ($129k/yr) — at the standard rent-burdened threshold; future hikes will face affordability resistance.
Forward outlook
- In year one you build about $22k of equity ($3k loan paydown + $19k appreciation (4.0% local appreciation)).
- Santa Barbara County population projected at +20% by 2050 — long-run rental-demand tailwind backs the buy-and-hold thesis.
- At projected returns (4.0% appreciation + 3.0% rent growth), your $133k cash investment doubles in ~5 years — after that, you're playing with house money.
- By year 2, paydown + projected appreciation supports a ~$36k cash-out refi (75% LTV) — recoverable capital for the next deal without selling this one.
Negotiation context
- It's been on market 263 days — a 12% lower offer ($418k) is reasonable based on typical stale-listing flexibility.
- 5 sale attempts since 25y ago; this cycle's ask has dropped $74k (13%) from the opening price — seller is motivated, your offer sets the floor, not the list.
- Current owner paid $235k; list at $475k implies a 102% gain — meaningful room to come down on a strong offer.
Risks & watch-outs
- Climate carrying-cost: major wildfire risk; extreme-heat days projected 11→30/yr by 2055 (HVAC capex compounding) — expect insurance premiums to compound above CPI over the hold.
Questions for the listing agent
- It's been on market 263 days. Have you received any prior offers? Is the seller open to a 12% concession, seller financing, or rate buy-down credit?
- Built in 1978 — when were the roof, HVAC, electrical panel, plumbing, and water heater last replaced?
- Why hasn't it sold? Are there any deal-killer items the seller is aware of (foundation, flood, title, zoning, code violations)?
- Is there a deadline driving the sale (1031 exchange, divorce, estate, relocation)? That informs how much negotiation room exists.
- What's the average days-on-market for RENTAL listings here right now (not sales)? A rising rental-DOM trend means longer vacancies and softer asking-rent achievability than the comps imply.
- What's the recent tenant-quality profile in this submarket — average credit score on applications, eviction rate, late-payment / NSF rate, and stable-employment percentage? A property-management company in the area should have these aggregated.
- How much new for-sale + rental construction is in the pipeline within 1–3 miles? Heavy new supply typically softens prices + rents 12–24 months out; constrained supply supports both.
Investment metrics
- 1% rule
- 1.02% ✓
- Cap rate
- 7.63%
- Cash-on-cash
- 4.76%
- DSCR
- 1.21
- GRM
- 8.2
CMA / ARV
No comps found within radius.
Projected returns pro-forma
3.96% appreciation · 3.0% rent growth · sell at horizon
- IRR
- 14.4%
- Equity multiple
- 1.87×
- Total profit
- $115,359
- Equity at exit
- $239,614
- IRR
- 15.6%
- Equity multiple
- 3.52×
- Total profit
- $334,725
- Equity at exit
- $390,940
Cash invested: $133,000 (down + closing). Projections, not guarantees.
Landlord ↔ Tenant lean methodology
- Overall (STATE)
- 18 Strongly Tenant-Friendly
- State California
- 18 Strongly Tenant-Friendly · D+13
- County
- — inherits STATE
- City
- — inherits STATE
ZIP-level market 93110
- Home prices YoY
- 1.2%
- Active inventory
- 48
- Price-to-rent
- 8.2×
Monthly cashflow live
- Estimated rent
- $4,823 medium interval (Pro) →
- Mortgage (P&I)
- −$2,491
- Tax est. 1.5%
- −$594 /mo · $7,125/yr
- Insurance
- −$198
- HOA
- −$0
- Vacancy / Maint / Mgmt
- −$1,013
- Net cashflow
- $527
Break-even live
UW: 25.0% down · 7.5% · 30yr · 1.5% tax · 5.0% vac · 8.0% maint · 8.0% mgmt
Financing live
Cash to close
- Down payment
- $118,750
- Closing costs
- $14,250
- Reserves months
- —
- Total cash needed
- —
Loan-product check · same deal, 3 products live
Conventional
25% down · 7.5% · 30yr
- Down + closing
- —
- Monthly P&I
- —
- Monthly cashflow
- —
- DSCR
- —
- Eligible?
- —
Personal DTI + credit; lowest rate.
DSCR
20% down · 8.5% · 30yr
- Down + closing
- —
- Monthly P&I
- —
- Monthly cashflow
- —
- DSCR
- —
- Eligible?
- —
No personal income docs; deal must DSCR.
Hard money
10% down · 12.0% · 12mo
- Down + closing
- —
- Monthly P&I
- —
- Monthly cashflow
- —
- DSCR
- —
- Eligible?
- —
Short-term bridge; refi at stabilization.
Rent comps 4 comps
| Address | Beds | Baths | Sqft | Rent | $/sqft | DOM | Units | Dist |
|---|---|---|---|---|---|---|---|---|
| 4099 Foothill Rd Santa Barbara, CA | 2.0–3.0 | 1.5–2.5 | 1450 | $4,700 | $3.24 | 14d | 2 | 0.22mi |
| 4120 Via Andorra Unit A Santa Barbara, CA | 3.0 | 2.5 | 1456 | $5,950 | $4.09 | 23d | 1 | 0.38mi |
| 4632 Tajo Dr Santa Barbara, CA | 3.0 | 2.0 | 1251 | $5,150 | $4.12 | 14d | 1 | 1.35mi |
| 30 La Cumbre Cir Santa Barbara, CA | 2.0 | 2.0 | 1092 | $4,400 | $4.03 | 13d | 1 | 1.49mi |
Listing history 28 events
-
2026-06-18days on market $475,000 Active 263 DOM
-
2026-06-17days on market $475,000 Active 262 DOM
-
2026-06-16days on market $475,000 Active 261 DOM
-
2026-06-15days on market $475,000 Active 260 DOM
-
2026-06-14days on market $475,000 Active 258 DOM
-
2026-06-10days on market $475,000 Active 255 DOM
-
2026-06-09days on market $475,000 Active 254 DOM
-
2026-06-08days on market $475,000 Active 253 DOM
-
2026-06-07days on market $475,000 Active 252 DOM
-
2026-06-03days on market $475,000 Active 248 DOM
-
2026-06-02days on market $475,000 Active 247 DOM
-
2026-06-01days on market $475,000 Active 246 DOM
-
2026-05-31days on market $475,000 Active 245 DOM
-
2026-05-30days on market $475,000 Active 244 DOM
-
2026-04-28price $475,000
-
2026-03-29status Active
-
2026-03-28historical
-
2025-12-02price $499,000
-
2025-09-27$549,000 Active
-
2025-09-25historical $549,000
-
2025-08-27historical
-
2025-07-23price $549,000
-
2025-06-12$579,000 Active
-
2010-05-27soldstatus $235,000 412-char remark
Show marketing remark (412 chars)
Something totally special- rarely on the market- located on the meadow, triple-wide remodeled home with private redwood deck in this country club style park for 55+. Light & bright on the interior, bonus rooms used for office, study, art studio? Sunroom, master suite with walk-in closet, open&airy floor plan. Kitchen w/an abundance of counter space & storage. Just moments from community amenities.
-
2009-09-10$259,000 412-char remark
Show marketing remark (412 chars)
Something totally special- rarely on the market- located on the meadow, triple-wide remodeled home with private redwood deck in this country club style park for 55+. Light & bright on the interior, bonus rooms used for office, study, art studio? Sunroom, master suite with walk-in closet, open&airy floor plan. Kitchen w/an abundance of counter space & storage. Just moments from community amenities.
-
2002-02-12soldstatus $250,000
-
2002-01-24historical
-
2001-10-28$260,000
ⓘ Source: listings_history table (triggers on properties + properties_extension) + one-shot
backfill from property_details.listing_events for pre-trigger history.
Climate risk First Street
- Flood 1/10 Low FEMA zone X (unshaded) · 0% chance over 30 yrs
- Wildfire 6/10 Major
- Heat 7/10 Severe 11 d/yr ≥83°F today · 30 d/yr by 30 yrs out
- Wind 1/10 Low
- Air quality 6/10 Major 10 unhealthy d/yr today · 10 by 30 yrs out
Nearby sold comps map
Loading sold comps map…
Walkable amenities ~0.75 mi
Loading nearby amenities…
Taxation est. · year 1
- Rental income
- $57,875
- − Mortgage interest
- −$26,607
- − Property taxes
- −$7,125
- − Insurance
- −$2,375
- − Repairs & maintenance
- −$4,630
- − Management
- −$4,630
- − Depreciation
- −$13,818
- Taxable loss
- −$1,311
- Est. tax savings @ 24.0%
- +$315
- After-tax cash flow
- $6,644/yr
For passive investors: Depreciation is non-cash, so a rental often shows a tax loss while cash-flowing — sheltering income. Rental losses are passive: they offset passive income freely, and up to $25,000/yr can offset ordinary (W-2) income if you actively participate and your MAGI is under $100k (phasing out to $0 by $150k); unused losses carry forward. On sale, claimed depreciation is recaptured at up to 25%, and gains may owe capital-gains tax (a 1031 exchange can defer both). Figures are a year-1 estimate at your 24.0% rate — not tax advice; consult a CPA.
Schools (NCES district)
No district data.
Livability — Eastern Goleta Valley
No livability data for this city. (Only ~50 U.S. cities are tracked.)
Census & demographics
- Census place
- Eastern Goleta Valley, CA
- County
- Santa Barbara County · 410,380 people
- City population
- 34,619
- Metro
- Santa Maria-Santa Barbara, CA
- Population (ZIP)
- 15,436
- Household income
- $129,209
- Rent vs Own
- Severe rent burden
- 415.0
Population outlook (Santa Barbara County) Hauer SSP2
- Today (2025)
- 484,679 people
- By 2030
- 505,323 · +4.3%
- By 2040
- 545,783 · +12.6%
- By 2050
- 584,263 · +20.5%
- By 2075
- 682,586 · +40.8%
- By 2100
- 723,188 · +49.2%
Race, ethnicity, and origin ACS 2023
- Neighborhood character
- Diverse neighborhood (Simpson 0.56)
- Race & ethnicity
- White 59% Hispanic / Latino 32% Two or more races 14% Asian 5% Black 1%
- Hispanic origin (detail)
- Mexican 25%
- Common ancestry
- Italian 3% Romanian 3% Lithuanian 2%
- Foreign-born
- 17% · Canada, China
- Languages at home
- 76% English-only · Spanish 17% Other Indo-European 3% Other Asian/Pacific 2%
Political lean MEDSL · Santa Barbara
- 2024 margin
- Strong D (+26.7) · D 61.8% · R 35.1% · Other 3.1%
- 2008→2024 swing
- +3.8pp toward D · 2008: 22.9pp · 2024: 26.7pp
- All cycles
- 2024: D+26.7 2020: D+32.1 2016: D+28.2 2012: D+17.1 2008: D+22.9
Not yet ingested
- Civics
- —
Market trends
- HPI YoY
- ▲ 3.96%
- Current HPI
- 323.0805
- Rent YoY
- —
- Metro
- Santa Maria-Santa Barbara, CA
- State GDP YoY
- ▲ 3.21%
- F500 in state
- 116
Industry mix (Fortune 500 HQ in CA)
| Industry | F500 HQs | Revenue |
|---|---|---|
| Technology | 27 | $1,492B |
|
||
| Financial Services | 3 | $174B |
|
||
| Retail | 3 | $44B |
|
||
| Insurance | 3 | $26B |
|
||
| Media / Entertainment | 2 | $115B |
|
||
| Pharmaceuticals / Biotech | 2 | $62B |
|
||
Price history
+82.7% since first listed14 events — show timeline
- 2026-04-28 Price Changed $475,000 SBMLS
- 2026-03-29 Relisted — SBMLS
- 2026-03-28 Listing Removed — SBMLS
- 2025-12-02 Price Changed $499,000 SBMLS
- 2025-09-27 Listed $549,000 SBMLS
- 2025-09-25 Coming Soon $549,000 SBMLS
- 2025-08-27 Listing Removed — SBMLS
- 2025-07-23 Price Changed $549,000 SBMLS
- 2025-06-12 Listed $579,000 SBMLS
- 2010-05-27 Sold (MLS) $235,000 SBMLS
- 2009-09-10 Listed $259,000 SBMLS
- 2002-02-12 Sold (MLS) $250,000 SBMLS
- 2002-01-24 Listing Removed — SBMLS
- 2001-10-28 Listed $260,000 SBMLS
Cash-flow waterfall
monthlySold comps — $/sqft
last 12 mo · ≤1 miLoading sold comps…