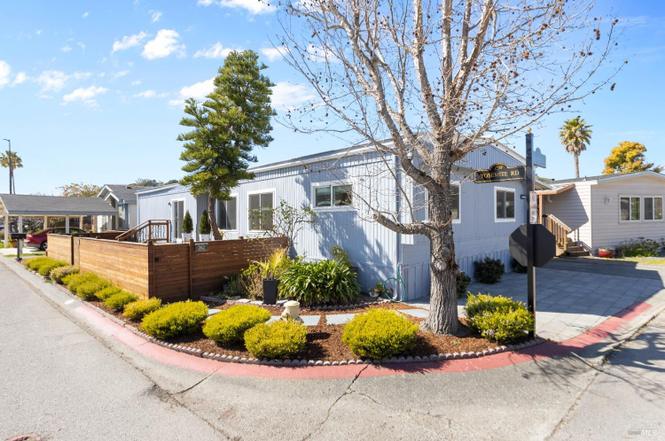
363 Glacier Way
San Rafael, CA 94903
$399,000C+
4 bd · 2.0 ba ·
1,440 sqft ·
Built 1975
· Manufactured
· Active
· 462 DOM
Cashflow @ list (25.0% down · 7.5%)
Estimated rent
$4,875/mo
Mortgage (P&I)
−$2,092
Tax + insurance
−$665
HOA
−$0
Vac / Maint / Mgmt
−$1,024
Net cashflow
$1,094/mo
Annual
$13,128/yr
Cap rate
9.58%
Cash-on-cash
11.75%
DSCR
1.52
1% rule
1.22%
Cash to close
$111,720
Investor read
- This is a 4-bed/2.0-bath manufactured listed at $399k.
- At list price, monthly cash flow is $1k ($13k/yr) — positive.
- The deal already cash-flows at list — no discount required.
- Meets the 1% rule at list price ($5k rent vs $399k).
- It's been on market 462 days — a 12% lower offer ($351k) is reasonable based on typical stale-listing flexibility.
- Recommended offer: $351k (12.0% below list) — sets the bar for market timing.
- Local home prices are declining (-3.0%/yr); year-one equity from $3k of loan paydown is wiped out by about $12k of value loss. Plan a longer hold.
- Location reads 66/100 on livability (#358 in CA) — a middle-class / working-renter tenant base. Strengths: commute A+, employment A+, health & safety B+; Watch: schools C-, crime F, amenities F.
- San Rafael City High (urban): math 43% / reading 56% proficiency, ranked #126 of 517 in CA (top 24%) — families likely to look elsewhere, expect single-tenant / working-renter base with shorter leases.
- Market conditions: Rents rising (+1.6%/yr); 121 active listings in the ZIP; 6 comparable units currently listed for rent nearby; rentals leasing fast (median 11d on market — plan ~1-2 weeks tenant-placement turnaround); high-income renter base; 149 units permitted in Marin County in 2024 (5 in 5+ unit buildings).
- Marin County population projected at +9% by 2050 — modest demand growth; plan on rents tracking national, not racing it.
- 3 sale attempts; this cycle's ask has dropped $86k (18%) from the opening price — seller is motivated, your offer sets the floor, not the list.
- Cap rate 9.6% vs local median 1.7% in San Rafael — top-decile yield for the area; either an underpriced asset or a hidden risk that comps aren't pricing in. Stress-test before assuming the spread holds.
- This rent runs 41% of the median local income ($142k/yr) — at the standard rent-burdened threshold; future hikes will face affordability resistance.
Questions for listing agent
- It's been on market 462 days. Have you received any prior offers? Is the seller open to a 12% concession, seller financing, or rate buy-down credit?
- Built in 1975 — when were the roof, HVAC, electrical panel, plumbing, and water heater last replaced?
- Why hasn't it sold? Are there any deal-killer items the seller is aware of (foundation, flood, title, zoning, code violations)?
- Is there a deadline driving the sale (1031 exchange, divorce, estate, relocation)? That informs how much negotiation room exists.
- Crime grade is F in this area — have there been break-ins, vandalism, or insurance claims at this property in the last 3 years? What carrier currently insures it and at what premium?
- What's the average days-on-market for RENTAL listings here right now (not sales)? A rising rental-DOM trend means longer vacancies and softer asking-rent achievability than the comps imply.
- What's the recent tenant-quality profile in this submarket — average credit score on applications, eviction rate, late-payment / NSF rate, and stable-employment percentage? A property-management company in the area should have these aggregated.
- How much new for-sale + rental construction is in the pipeline within 1–3 miles? Heavy new supply typically softens prices + rents 12–24 months out; constrained supply supports both.
CashFlowRE · CFR-GPEN5J6M50TN7F
· Data 2 days ago
cashflowre.app · 2026-05-29