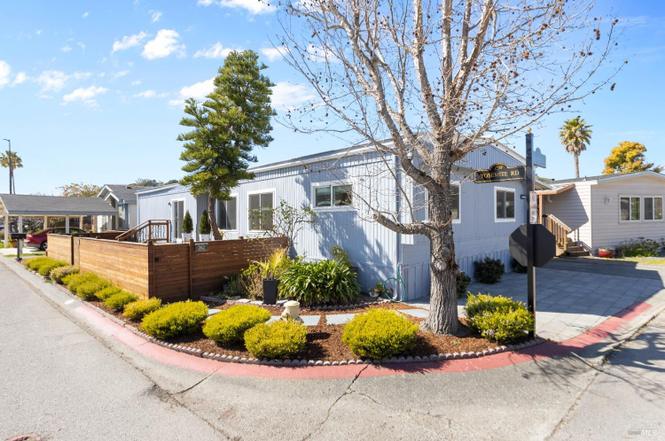
363 Glacier Way · San Rafael, CA
Flood risk No data
- FEMA flood zone
- —
- Chance of flooding over 30 yrs
- —
- Est. flood insurance / yr
- —
Fire risk No data
- Est. fire insurance / yr
- —
Heat risk No data
- Hot days now (above threshold)
- —
- Hot days in 30 yrs
- —
Wind risk No data
- Chance of severe wind over 30 yrs
- —
Air-quality risk No data
- Unhealthy air days now
- —
- Unhealthy air days in 30 yrs
- —
Risk factors via First Street. Map © Google.
Why this score? — see what drove the C+ grade
The composite is a weighted blend of 9 inputs, each scored 0–100. Each bar is that input's sub-score; the figure is the points it added to the 100-point composite (weight × sub-score).
- Cash flow +26.4/30.0
- DSCR +9.0/10.0
- ARV discount +7.3/15.0
- 1% rule +7.1/10.0
- Schools +4.6/10.0
- Livability +3.3/5.0
- Rent growth +2.9/5.0
- Condition / age +2.5/5.0
- Appreciation +0.0/10.0
$399,000
🖨 Deal sheet 📄 Offer letter ✓ Due diligence
Listing remarks
Price Reduction on this four bedroom two bath mobile home Step into this light-filled, beautifully remodeled manufactured home that blends modern style with everyday comfort in desirable Contempo Marin in San Rafael. Designed with an open-concept layout, the spacious living room flows effortlessly into a sleek, contemporary kitchen perfect for entertaining or simply enjoying daily life. Smart home technology enhances convenience, allowing you to control lighting, security, heating, and air conditioning right from your phone. The well-planned floor layout offers four bedrooms thoughtfully positioned for privacy, along with two tastefully updated bathrooms featuring modern walk-in showers. En
Key facts
- Master suite
- Open floor plan
- Private bathroom
Tags
Property features AI
Finance
- Financial info: Monthly land lease: $2,214
- HOA & community: No association; Not a senior community; Located in Contempo Marin park
Exterior
- Parking: Off-street parking (2 spaces); No garage
- Security: Smoke detector; Video security system
- Utilities: Cable available; DSL available; Internet available; Public sewer
- Home design: Manufactured home in park; Double wide
- Construction: Fleetwood manufacturer (mobile home); No skirt
- Exterior features: Porch steps; Corner lot; Fenced yard; Front yard landscaping
Interior
- Kitchen: Dishwasher; Disposal; Hood over range; Free-standing refrigerator; Electric water heater
- Bedrooms: 4 bedrooms
- Flooring: Laminate flooring
- Bathrooms: 2 full bathrooms; Shower stall(s)
- Heating & cooling: Central heating; Central air conditioning
- Interior features: Updated/remodeled interior; Great room; Smoke detector; Video security system; Double-strapped water heater; See remarks (additional security info)
- Laundry & utility: Inside laundry hookups
Neighborhood map
What this means for you Summary
Snapshot
- This is a 4-bed/2.0-bath manufactured listed at $399k.
Deal economics
- At list price, monthly cash flow is $1k ($13k/yr) — positive.
- The deal already cash-flows at list — no discount required.
- Meets the 1% rule at list price ($5k rent vs $399k).
- Recommended offer: $351k (12.0% below list) — sets the bar for market timing.
- Cap rate 9.4% vs local median 1.7% in San Rafael — top-decile yield for the area; either an underpriced asset or a hidden risk that comps aren't pricing in. Stress-test before assuming the spread holds.
Location & tenants
- Location reads 66/100 on livability (#358 in CA) — a middle-class / working-renter tenant base. Strengths: commute A+, employment A+, health & safety B+; Watch: schools C-, crime F, amenities F.
- San Rafael City High (urban): math 43% / reading 56% proficiency, ranked #126 of 517 in CA (top 24%) — families likely to look elsewhere, expect single-tenant / working-renter base with shorter leases.
- Market conditions: Rents rising (+1.6%/yr); 121 active listings in the ZIP; 7 comparable units currently listed for rent nearby; rentals leasing fast (median 3d on market — plan ~1-2 weeks tenant-placement turnaround); high-income renter base; 149 units permitted in Marin County in 2024 (5 in 5+ unit buildings).
- This rent runs 41% of the median local income ($142k/yr) — at the standard rent-burdened threshold; future hikes will face affordability resistance.
Forward outlook
- Local home prices are declining (-3.0%/yr); year-one equity from $3k of loan paydown is wiped out by about $12k of value loss. Plan a longer hold.
- Marin County population projected at +9% by 2050 — modest demand growth; plan on rents tracking national, not racing it.
Negotiation context
- It's been on market 462 days — a 12% lower offer ($351k) is reasonable based on typical stale-listing flexibility.
- 3 sale attempts; this cycle's ask has dropped $86k (18%) from the opening price — seller is motivated, your offer sets the floor, not the list.
Questions for the listing agent
- It's been on market 462 days. Have you received any prior offers? Is the seller open to a 12% concession, seller financing, or rate buy-down credit?
- Built in 1975 — when were the roof, HVAC, electrical panel, plumbing, and water heater last replaced?
- Why hasn't it sold? Are there any deal-killer items the seller is aware of (foundation, flood, title, zoning, code violations)?
- Is there a deadline driving the sale (1031 exchange, divorce, estate, relocation)? That informs how much negotiation room exists.
- Crime grade is F in this area — have there been break-ins, vandalism, or insurance claims at this property in the last 3 years? What carrier currently insures it and at what premium?
- What's the average days-on-market for RENTAL listings here right now (not sales)? A rising rental-DOM trend means longer vacancies and softer asking-rent achievability than the comps imply.
- What's the recent tenant-quality profile in this submarket — average credit score on applications, eviction rate, late-payment / NSF rate, and stable-employment percentage? A property-management company in the area should have these aggregated.
- How much new for-sale + rental construction is in the pipeline within 1–3 miles? Heavy new supply typically softens prices + rents 12–24 months out; constrained supply supports both.
Investment metrics
- 1% rule
- 1.21% ✓
- Cap rate
- 9.44%
- Cash-on-cash
- 11.24%
- DSCR
- 1.50
- GRM
- 6.9
CMA / ARV
- ARV (on-the-fly)
- $397,440
- Comps found
- 12
Show comp detail 12 sales within ~0.75 mi
| Address | Dist | Beds/Ba | Sqft | Sold | Price | $/sf | Match |
|---|---|---|---|---|---|---|---|
| 275 Carlsbad Ct | 0.19mi | 4/2.0 | 1,440 (0%) | 4mo | $380,000 | $264 | 87 |
| 304 Zion Ct | 0.21mi | 3/2.0 (-1) | 1,440 (0%) | 1mo | $275,000 | $191 | 85 |
| 337 Acadia Ln | 0.05mi | 3/2.0 (-1) | 1,352 (-6%) | 10mo | $190,000 | $141 | 74 |
| 243 Teton Ct | 0.11mi | 3/2.0 (-1) | 1,344 (-7%) | 6mo | $180,000 | $134 | 74 |
| 353 Yosemite Rd | 0.09mi | 3/2.0 (-1) | 1,440 (0%) | 21mo | $505,000 | $351 | 73 |
| 92 Yosemite Rd | 0.05mi | 3/2.0 (-1) | 1,450 (+1%) | 22mo | $400,000 | $276 | 73 |
| 239 Teton Ct | 0.09mi | 3/2.0 (-1) | 1,620 (+12%) | 2mo | $505,000 | $312 | 69 |
| 37 Yosemite Rd | 0.14mi | 3/2.0 (-1) | 1,560 (+8%) | 9mo | $460,000 | $295 | 67 |
| 20 Yosemite Rd | 0.18mi | 3/2.0 (-1) | 1,344 (-7%) | 17mo | $280,000 | $208 | 61 |
| 223 Olympic Way | 0.09mi | 3/2.0 (-1) | 1,236 (-14%) | 10mo | $350,000 | $283 | 58 |
| 169 Yosemite Rd | 0.26mi | 3/2.0 (-1) | 1,344 (-7%) | 20mo | $280,000 | $208 | 55 |
| 45 Yosemite Rd | 0.22mi | 3/2.0 (-1) | 1,236 (-14%) | 10mo | $409,000 | $331 | 53 |
Match score weights: distance 35% · size 25% · config 20% · recency 20%. Top-matched comps best support the ARV.
Projected returns pro-forma
-3.0% appreciation · 1.62% rent growth · sell at horizon
- IRR
- -1.1%
- Equity multiple
- 0.96×
- Total profit
- $-4,526
- Equity at exit
- $59,492
- IRR
- 7.1%
- Equity multiple
- 1.50×
- Total profit
- $55,856
- Equity at exit
- $34,498
Cash invested: $111,720 (down + closing). Projections, not guarantees.
Landlord ↔ Tenant lean methodology
- Overall (STATE)
- 18 Strongly Tenant-Friendly
- State California
- 18 Strongly Tenant-Friendly · D+13
- County
- — inherits STATE
- City
- — inherits STATE
ZIP-level market 94903
- Rents YoY
- 1.6%
- Active inventory
- 121
- Price-to-rent
- 6.9×
Monthly cashflow live
- Estimated rent
- $4,815 high interval (Pro) →
- Mortgage (P&I)
- −$2,092
- Tax est. 1.5%
- −$499 /mo · $5,985/yr
- Insurance
- −$166
- HOA
- −$0
- Vacancy / Maint / Mgmt
- −$1,011
- Net cashflow
- $1,046
Break-even live
UW: 25.0% down · 7.5% · 30yr · 1.5% tax · 5.0% vac · 8.0% maint · 8.0% mgmt
Financing live
Cash to close
- Down payment
- $99,750
- Closing costs
- $11,970
- Reserves months
- —
- Total cash needed
- —
Loan-product check · same deal, 3 products live
Conventional
25% down · 7.5% · 30yr
- Down + closing
- —
- Monthly P&I
- —
- Monthly cashflow
- —
- DSCR
- —
- Eligible?
- —
Personal DTI + credit; lowest rate.
DSCR
20% down · 8.5% · 30yr
- Down + closing
- —
- Monthly P&I
- —
- Monthly cashflow
- —
- DSCR
- —
- Eligible?
- —
No personal income docs; deal must DSCR.
Hard money
10% down · 12.0% · 12mo
- Down + closing
- —
- Monthly P&I
- —
- Monthly cashflow
- —
- DSCR
- —
- Eligible?
- —
Short-term bridge; refi at stabilization.
Rent comps 7 comps
| Address | Beds | Baths | Sqft | Rent | $/sqft | DOM | Units | Dist |
|---|---|---|---|---|---|---|---|---|
| 108 Professional Center Pkwy San Rafael, CA | 3.0 | 2.0 | 1200 | $3,195 | $2.66 | 2d | 1 | 0.52mi |
| 219 Mark Twain Ave San Rafael, CA | 3.0 | 2.0 | 1601 | $5,850 | $3.65 | 2d | 1 | 0.57mi |
| 2500 Deer Valley Rd San Rafael, CA | 1.0–3.0 | 1.0–2.0 | 932 | $4,267 | $4.58 | 2d | 7 | 0.59mi |
| 1001 Cresta Way San Rafael, CA | 1.0–3.0 | 1.0–2.0 | 1025 | $4,681 | $4.57 | 2d | 21 | 0.71mi |
| 53 Labrea Way San Rafael, CA | 3.0 | 2.0 | 1220 | $5,800 | $4.75 | 17d | 1 | 0.78mi |
| 267 Orris Ter San Rafael, CA | 3.0 | 2.0 | 1432 | $5,000 | $3.49 | 24d | 1 | 0.92mi |
| 41 Pine Tree Ct San Rafael, CA | 3.0 | 2.5 | 1587 | $5,500 | $3.47 | 10d | 1 | 1.23mi |
Listing history 21 events
-
2026-06-18days on market $399,000 Active 462 DOM
-
2026-06-17days on market $399,000 Active 461 DOM
-
2026-06-16days on market $399,000 Active 460 DOM
-
2026-06-15days on market $399,000 Active 459 DOM
-
2026-06-13days on market $399,000 Active 457 DOM
-
2026-06-09days on market $399,000 Active 453 DOM
-
2026-06-08days on market $399,000 Active 452 DOM
-
2026-06-07pricedays on market $399,000 Active 451 DOM
-
2026-06-04days on market $420,000 Active 448 DOM
-
2026-06-03days on market $420,000 Active 447 DOM
-
2026-06-02days on market $420,000 Active 446 DOM
-
2026-06-01days on market $420,000 Active 445 DOM
-
2026-05-31days on market $420,000 Active 444 DOM
-
2026-04-06price $420,000
-
2026-04-06price $399,000
-
2026-02-07status Active
-
2026-01-26historical Contingent (No Show)
-
2025-11-28price $440,000
-
2025-09-05status Active
-
2025-07-11price $460,750
-
2025-03-11$485,000 Active
ⓘ Source: listings_history table (triggers on properties + properties_extension) + one-shot
backfill from property_details.listing_events for pre-trigger history.
Nearby sold comps map
Loading sold comps map…
Walkable amenities ~0.75 mi
Loading nearby amenities…
Taxation est. · year 1
- Rental income
- $57,781
- − Mortgage interest
- −$22,350
- − Property taxes
- −$5,985
- − Insurance
- −$1,995
- − Repairs & maintenance
- −$4,622
- − Management
- −$4,622
- − Depreciation
- −$11,607
- Taxable income
- $6,598
- Est. tax owed @ 24.0%
- −$1,584
- After-tax cash flow
- $10,974/yr
For passive investors: Depreciation is non-cash, so a rental often shows a tax loss while cash-flowing — sheltering income. Rental losses are passive: they offset passive income freely, and up to $25,000/yr can offset ordinary (W-2) income if you actively participate and your MAGI is under $100k (phasing out to $0 by $150k); unused losses carry forward. On sale, claimed depreciation is recaptured at up to 25%, and gains may owe capital-gains tax (a 1031 exchange can defer both). Figures are a year-1 estimate at your 24.0% rate — not tax advice; consult a CPA.
Schools (NCES district)
- District
- San Rafael City High
- NCES district ID
- 0635110
- Math proficiency
- 43% ▲ 8.00%
- Reading proficiency
- 56% ▲ 4.00%
- Median HH income
- $84,104
- Composite
- 45.58/100
- National rank
- #2594
- State rank
- #126 of 517 in CA
Livability — San Rafael
- Score
- 66/100
- State rank
- #358
- US rank
- #12194
Category grades
Schools grade is shown separately in the Schools card above.
Census & demographics
- Census place
- San Rafael, CA
- County
- Marin County · 243,328 people
- City population
- 71,922
- Metro
- San Francisco-Oakland-Berkeley, CA
- Population (ZIP)
- 30,615
- Household income
- $142,083
- Rent vs Own
- Severe rent burden
- 1414.0
Population outlook (Marin County) Hauer SSP2
- Today (2025)
- 276,379 people
- By 2030
- 282,942 · +2.4%
- By 2040
- 292,937 · +6.0%
- By 2050
- 300,449 · +8.7%
- By 2075
- 316,946 · +14.7%
- By 2100
- 303,948 · +10.0%
Race, ethnicity, and origin ACS 2023
- Neighborhood character
- Predominantly White (65%)
- Race & ethnicity
- White 65% Hispanic / Latino 19% Two or more races 10% Asian 6% Black 4%
- Hispanic origin (detail)
- Mexican 10% Puerto Rican 2%
- Common ancestry
- Italian 4% Lithuanian 3% Scotch-Irish 2%
- Foreign-born
- 21% · Canada, China, South Korea
- Languages at home
- 77% English-only · Spanish 11% Other Indo-European 3% Korean 1%
Political lean MEDSL · Marin
- 2024 margin
- Solid D (+63.9) · D 80.6% · R 16.7% · Other 2.7%
- 2008→2024 swing
- +6.2pp toward D · 2008: 57.7pp · 2024: 63.9pp
- All cycles
- 2024: D+63.9 2020: D+66.5 2016: D+62.9 2012: D+50.5 2008: D+57.7
Not yet ingested
- Civics
- —
Market trends
- HPI YoY
- ▼ -893.58%
- Current HPI
- 303.8086
- Rent YoY
- ▲ 1.62%
- Metro
- San Francisco-Oakland-Berkeley, CA
- State GDP YoY
- ▲ 3.21%
- F500 in state
- 116
Industry mix (Fortune 500 HQ in CA)
| Industry | F500 HQs | Revenue |
|---|---|---|
| Technology | 27 | $1,492B |
|
||
| Financial Services | 3 | $174B |
|
||
| Retail | 3 | $44B |
|
||
| Insurance | 3 | $26B |
|
||
| Media / Entertainment | 2 | $115B |
|
||
| Pharmaceuticals / Biotech | 2 | $62B |
|
||
Price history
-13.4% since first listed8 events — show timeline
- 2026-04-06 Price Changed $420,000 BAREIS
- 2026-04-06 Price Changed $399,000 BAREIS
- 2026-02-07 Relisted — BAREIS
- 2026-01-26 Contingent — BAREIS
- 2025-11-28 Price Changed $440,000 BAREIS
- 2025-09-05 Relisted — BAREIS
- 2025-07-11 Price Changed $460,750 BAREIS
- 2025-03-11 Listed $485,000 BAREIS
Cash-flow waterfall
monthlySold comps — $/sqft
last 12 mo · ≤1 miLoading sold comps…