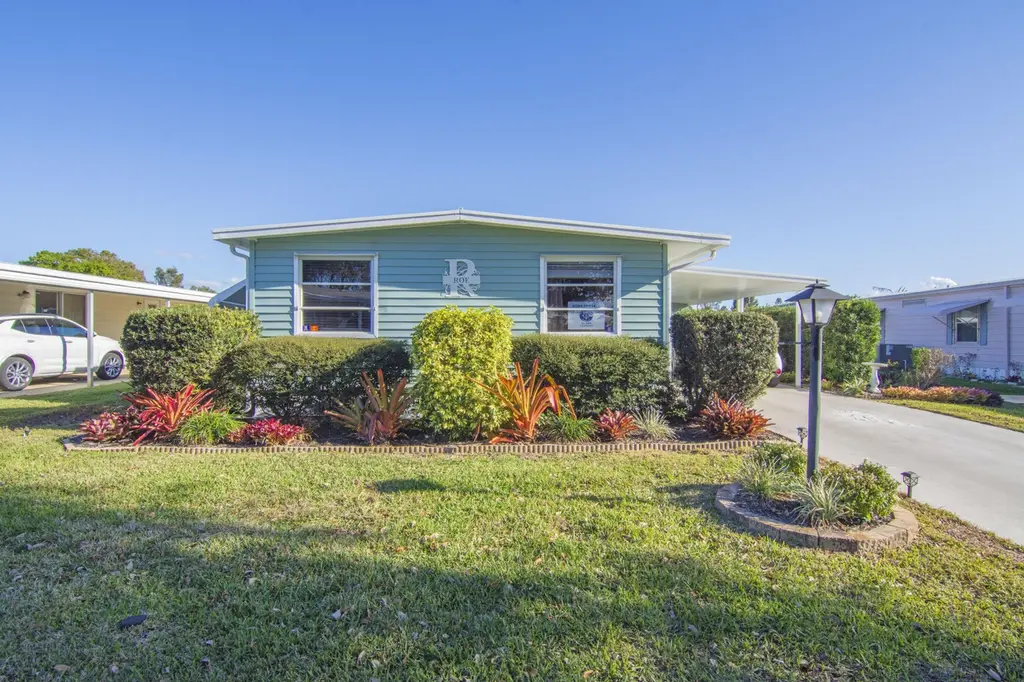
485 Onyx Way
Jensen Beach, FL 34957
$54,900B+
2 bd · 2.0 ba ·
1,160 sqft ·
Built 1981
· Manufactured
· Active
· 139 DOM
Cashflow @ list (25.0% down · 7.5%)
Estimated rent
$2,259/mo
Mortgage (P&I)
−$288
Tax + insurance
−$92
HOA
−$0
Vac / Maint / Mgmt
−$474
Net cashflow
$1,405/mo
Annual
$16,865/yr
Cap rate
37.01%
Cash-on-cash
109.71%
DSCR
5.88
1% rule
4.12%
Cash to close
$15,372
Investor read
- This is a 2-bed/2.0-bath manufactured listed at $55k. Condition is rated good.
- At list price, monthly cash flow is $1k ($17k/yr) — positive.
- The deal already cash-flows at list — no discount required.
- Meets the 1% rule at list price ($2k rent vs $55k).
- It's been on market 139 days — a 12% lower offer ($48k) is reasonable based on typical stale-listing flexibility.
- Recommended offer: $48k (12.0% below list) — sets the bar for market timing.
- Local home prices are declining (-3.0%/yr); year-one equity from $380 of loan paydown is wiped out by about $2k of value loss. Plan a longer hold.
- Location reads 70/100 on livability (#432 in FL) — a middle-class / working-renter tenant base. Strengths: crime A+, housing A+, cost of living B+; Watch: amenities F, commute F, health & safety D-.
- Martin (suburban): math 52% / reading 53% proficiency, ranked #24 of 73 in FL (top 33%) — acceptable for families but not a draw, mixed tenant base, ~2y average lease.
- Market conditions: Rents rising (+1.0%/yr); 536 active listings in the ZIP; 26 comparable units currently listed for rent nearby; rentals at typical pace (median 24d on market — plan ~3-4 weeks tenant-placement turnaround); 737 units permitted in Martin County in 2024 (167 in 5+ unit buildings).
- Martin County population projected at +19% by 2050 — long-run rental-demand tailwind backs the buy-and-hold thesis.
- At projected returns (-3.0% appreciation + 1.0% rent growth), your $15k cash investment doubles in ~1 year — after that, you're playing with house money.
- Climate carrying-cost: severe wind risk, 99% chance of damaging wind over 30y; extreme-heat days projected 7→24/yr by 2055 (HVAC capex compounding) — expect insurance premiums to compound above CPI over the hold.
- Cap rate 37.0% vs local median 4.1% in Jensen Beach — top-decile yield for the area; either an underpriced asset or a hidden risk that comps aren't pricing in. Stress-test before assuming the spread holds.
- This rent runs 39% of the median local income ($70k/yr) — at the standard rent-burdened threshold; future hikes will face affordability resistance.
Questions for listing agent
- It's been on market 139 days. Have you received any prior offers? Is the seller open to a 12% concession, seller financing, or rate buy-down credit?
- Why hasn't it sold? Are there any deal-killer items the seller is aware of (foundation, flood, title, zoning, code violations)?
- Is there a deadline driving the sale (1031 exchange, divorce, estate, relocation)? That informs how much negotiation room exists.
- Schools are B-rated — typically a magnet for longer-tenancy family renters. What's the average tenant stay here, and is there a school-zone premium baked into asking?
- What's the average days-on-market for RENTAL listings here right now (not sales)? A rising rental-DOM trend means longer vacancies and softer asking-rent achievability than the comps imply.
- What's the recent tenant-quality profile in this submarket — average credit score on applications, eviction rate, late-payment / NSF rate, and stable-employment percentage? A property-management company in the area should have these aggregated.
- How much new for-sale + rental construction is in the pipeline within 1–3 miles? Heavy new supply typically softens prices + rents 12–24 months out; constrained supply supports both.
CashFlowRE · CFR-GPPCB9A5G4R8RN
· Data 2 days ago
cashflowre.app · 2026-05-29