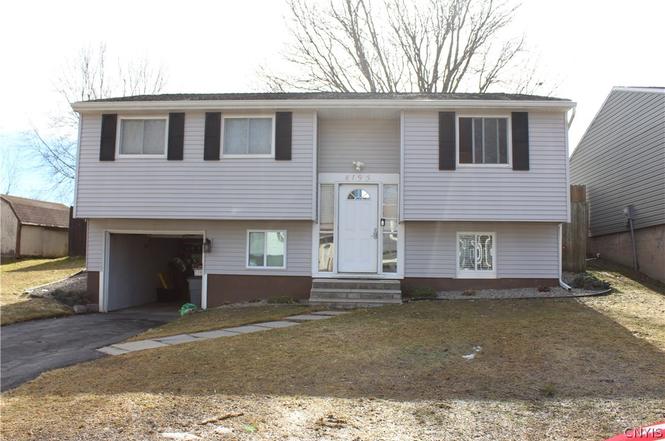
4195 Burningtree Rd
Radisson, NY 13090
$250,000D
3 bd · 1.0 ba ·
1,356 sqft ·
Built 1979
· SingleFamily
· Pending
· 47 DOM
Cashflow @ list (25.0% down · 7.5%)
Estimated rent
$2,417/mo
Mortgage (P&I)
−$1,311
Tax + insurance
−$606
HOA
−$0
Vac / Maint / Mgmt
−$507
Net cashflow
$-8/mo
Annual
$-90/yr
Cap rate
6.26%
Cash-on-cash
-0.13%
DSCR
0.99
1% rule
0.97%
Cash to close
$70,000
Investor read
- This is a 3-bed/1.0-bath single-family listed at $250k.
- At list price, monthly cash flow is $-8 ($-90/yr) — negative.
- To cash-flow at today's rent, offer at most $249k (0.5% below list).
- To meet the 1% rule (rent ≥ 1% of price), the offer needs to be $242k (3.3% below list).
- It's been on market 47 days — a 3% lower offer ($242k) is reasonable based on typical stale-listing flexibility.
- Recommended offer: $242k (3.3% below list) — sets the bar for 1% rule.
- Local home prices are declining (-3.0%/yr); year-one equity from $2k of loan paydown is wiped out by about $8k of value loss. Plan a longer hold.
- Location reads: area grade D — affects rentability + tenant quality, not the cash-flow math above.
- Liverpool Central School District (suburban): math 49% / reading 49% proficiency, ranked #381 of 590 in NY (top 65%) — families likely to look elsewhere, expect single-tenant / working-renter base with shorter leases.
- Market conditions: 96 active listings in the ZIP; 1 comparable units currently listed for rent nearby; solid renter incomes; 616 units permitted in Onondaga County in 2024 (256 in 5+ unit buildings).
- Onondaga County population projected to shrink 9% by 2050 — rents likely to lag national; underwrite the cash flow, not the appreciation.
- 4 sale attempts since 14y ago; this cycle's ask is 67% above the opening price — seller raised mid-cycle; expect resistance to lowballs.
- Current owner paid $186k; 35% above their basis — modest negotiation headroom, anchor on the comps not their cost.
- Climate carrying-cost: major flood risk — expect insurance premiums to compound above CPI over the hold.
- Cap rate 6.3% vs local median 3.5% in Radisson — top-decile yield for the area; either an underpriced asset or a hidden risk that comps aren't pricing in. Stress-test before assuming the spread holds.
- This rent runs 33% of the median local income ($88k/yr) — at the standard rent-burdened threshold; future hikes will face affordability resistance.
Questions for listing agent
- What do current leases actually rent for vs. the listed asking? Can we see a recent rent roll and the last 12 months of T-12 income?
- It's been on market 47 days. Have you received any prior offers? Is the seller open to a 3% concession, seller financing, or rate buy-down credit?
- Built in 1979 — when were the roof, HVAC, electrical panel, plumbing, and water heater last replaced?
- Is there a deadline driving the sale (1031 exchange, divorce, estate, relocation)? That informs how much negotiation room exists.
- The area grade is low — what's the realistic commute time and amenity access for the typical tenant pool here? Any planned neighborhood developments (good or bad) we should know about?
- What's the average days-on-market for RENTAL listings here right now (not sales)? A rising rental-DOM trend means longer vacancies and softer asking-rent achievability than the comps imply.
- What's the recent tenant-quality profile in this submarket — average credit score on applications, eviction rate, late-payment / NSF rate, and stable-employment percentage? A property-management company in the area should have these aggregated.
- How much new for-sale + rental construction is in the pipeline within 1–3 miles? Heavy new supply typically softens prices + rents 12–24 months out; constrained supply supports both.
CashFlowRE · CFR-GPRCAK693T2A52
· Data 3 weeks ago
cashflowre.app · 2026-05-29