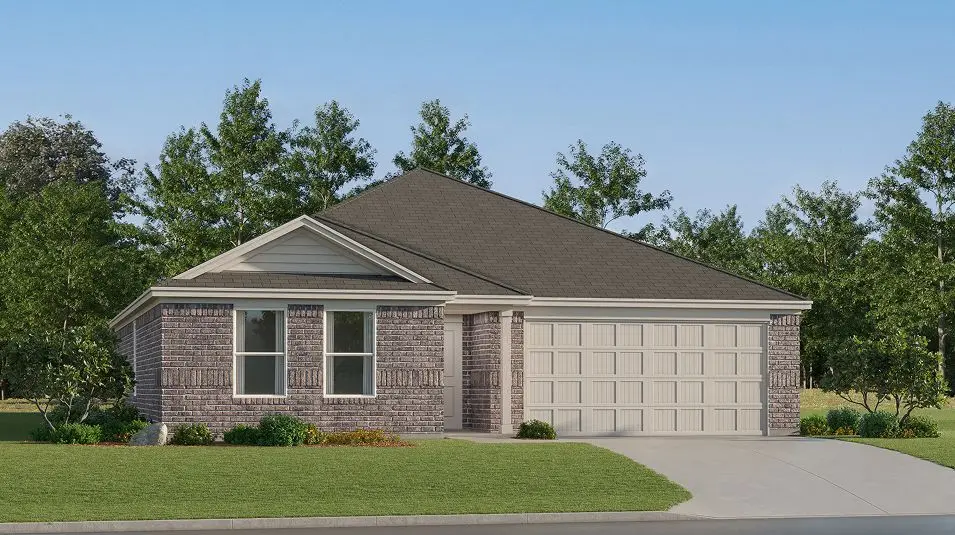
6206 Welsummer Way
Greenville, TX 75402
$222,999D-
3 bd · 2.0 ba ·
1,461 sqft ·
Built 2025
· Other
· Active
· 9 DOM
Cashflow @ list (25.0% down · 7.5%)
Estimated rent
$1,728/mo
Mortgage (P&I)
−$1,169
Tax + insurance
−$140
HOA
−$108
Vac / Maint / Mgmt
−$363
Net cashflow
$-52/mo
Annual
$-621/yr
Cap rate
6.01%
Cash-on-cash
-0.99%
DSCR
0.96
1% rule
0.78%
Cash to close
$62,440
Investor read
- This is a 3-bed/2.0-bath other listed at $223k.
- At list price, monthly cash flow is $-52 ($-621/yr) — negative.
- To cash-flow at today's rent, offer at most $214k (4.1% below list).
- To meet the 1% rule (rent ≥ 1% of price), the offer needs to be $173k (22.5% below list).
- Only 9 days on market — expect competitive offers; lowballing is unlikely to land.
- Recommended offer: $173k (22.5% below list) — sets the bar for 1% rule.
- Local home prices are declining (-3.0%/yr); year-one equity from $2k of loan paydown is wiped out by about $7k of value loss. Plan a longer hold.
- Location reads 77/100 on livability (#78 in TX, #2,719 nationally) — a middle-class / working-renter tenant base. Strengths: cost of living A+, housing A+, health & safety A; Watch: employment D, commute F.
- Greenville ISD (town): math 20% / reading 26% proficiency, ranked #743 of 826 in TX (top 90%) — low school quality limits family demand, transient renter base, plan for 1-2y turnover.
- Zoned schools: Lamar El (math 28% / reading 33%, grade F, #2,464 of 4,322 statewide, top 58%, 554 students, 59% FRL); Greenville Middle (math 17% / reading 28%, grade F, #1,341 of 1,662 statewide, top 82%, 727 students, 76% FRL); Greenville H S (math 17% / reading 37%, grade F, #1,204 of 1,632 statewide, top 75%, 1,480 students, 66% FRL).
- Market conditions: Rents soft (-1.0%/yr); 298 active listings in the ZIP; 40 comparable units currently listed for rent nearby; rentals at typical pace (median 19d on market — plan ~3-4 weeks tenant-placement turnaround); solid renter incomes; 1,289 units permitted in Hunt County in 2024 (527 in 5+ unit buildings).
- Hunt County population projected at +15% by 2050 — modest demand growth; plan on rents tracking national, not racing it.
- 2 sale attempts with the ask held roughly flat each time — persistent listings suggest the price (not the market) is what's stuck; bring a comps-based counter.
- Cap rate 6.0% vs local median 4.1% in Greenville — top-decile yield for the area; either an underpriced asset or a hidden risk that comps aren't pricing in. Stress-test before assuming the spread holds.
Questions for listing agent
- What do current leases actually rent for vs. the listed asking? Can we see a recent rent roll and the last 12 months of T-12 income?
- What does the HOA fee cover, when was the last increase, and are there any pending special assessments or reserve-fund shortfalls?
- Is there a deadline driving the sale (1031 exchange, divorce, estate, relocation)? That informs how much negotiation room exists.
- Schools are D-rated, which usually means shorter tenancies and higher turnover. Who's the typical renter profile here, and what's been the actual vacancy rate?
- The area grade is low — what's the realistic commute time and amenity access for the typical tenant pool here? Any planned neighborhood developments (good or bad) we should know about?
- What's the average days-on-market for RENTAL listings here right now (not sales)? A rising rental-DOM trend means longer vacancies and softer asking-rent achievability than the comps imply.
- What's the recent tenant-quality profile in this submarket — average credit score on applications, eviction rate, late-payment / NSF rate, and stable-employment percentage? A property-management company in the area should have these aggregated.
- How much new for-sale + rental construction is in the pipeline within 1–3 miles? Heavy new supply typically softens prices + rents 12–24 months out; constrained supply supports both.
CashFlowRE · CFR-GQEVPP9J3RWPM7
· Data 1 day ago
cashflowre.app · 2026-05-29