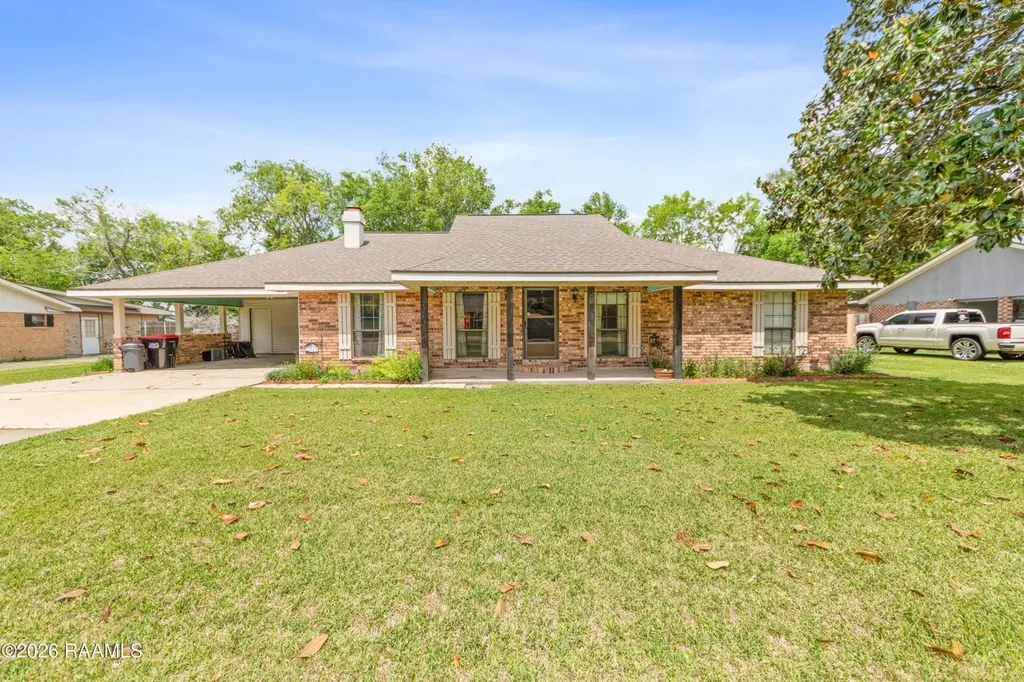
114 Hesper Dr
Carencro, LA 70520
$225,000D
3 bd · 2.0 ba ·
1,980 sqft ·
Built 1980
· SingleFamily
· Active
· 44 DOM
Cashflow @ list (25.0% down · 7.5%)
Estimated rent
$1,675/mo
Mortgage (P&I)
−$1,180
Tax + insurance
−$219
HOA
−$0
Vac / Maint / Mgmt
−$352
Net cashflow
$-76/mo
Annual
$-913/yr
Cap rate
5.89%
Cash-on-cash
-1.45%
DSCR
0.94
1% rule
0.74%
Cash to close
$63,000
Investor read
- This is a 3-bed/2.0-bath single-family listed at $225k.
- At list price, monthly cash flow is $-76 ($-913/yr) — negative.
- To cash-flow at today's rent, offer at most $212k (6.0% below list).
- To meet the 1% rule (rent ≥ 1% of price), the offer needs to be $168k (25.6% below list).
- It's been on market 44 days — a 3% lower offer ($218k) is reasonable based on typical stale-listing flexibility.
- Recommended offer: $168k (25.6% below list) — sets the bar for 1% rule.
- Local home prices are declining (-3.0%/yr); year-one equity from $2k of loan paydown is wiped out by about $7k of value loss. Plan a longer hold.
- Location reads 69/100 on livability (#65 in LA) — a middle-class / working-renter tenant base. Strengths: cost of living A+, housing A+, health & safety A+; Watch: employment C-, crime D, amenities F.
- Lafayette Parish (urban): math 38% / reading 46% proficiency, ranked #19 of 98 in LA (top 19%) — families likely to look elsewhere, expect single-tenant / working-renter base with shorter leases.
- Zoned schools: J. Wallace James Elementary School (math 46% / reading 49%, grade D, #147 of 646 statewide, top 23%, 939 students, 64% FRL); Carencro Middle School (math 18% / reading 28%, grade F, #145 of 218 statewide, top 69%, 665 students, 75% FRL); Carencro High School (math 30% / reading 29%, grade F, #127 of 265 statewide, top 49%, 1,096 students, 69% FRL).
- Market conditions: 281 active listings in the ZIP; 2 comparable units currently listed for rent nearby; 1,585 units permitted in Lafayette Parish in 2024 (10 in 5+ unit buildings).
- Lafayette County population projected at +34% by 2050 — long-run rental-demand tailwind backs the buy-and-hold thesis.
- 2 sale attempts since 2y ago with the ask held roughly flat each time — persistent listings suggest the price (not the market) is what's stuck; bring a comps-based counter.
- Climate carrying-cost: severe wind risk, 99% chance of damaging wind over 30y; extreme-heat days projected 7→20/yr by 2055 (HVAC capex compounding) — expect insurance premiums to compound above CPI over the hold.
Questions for listing agent
- What do current leases actually rent for vs. the listed asking? Can we see a recent rent roll and the last 12 months of T-12 income?
- It's been on market 44 days. Have you received any prior offers? Is the seller open to a 26% concession, seller financing, or rate buy-down credit?
- Is there a deadline driving the sale (1031 exchange, divorce, estate, relocation)? That informs how much negotiation room exists.
- Crime grade is D in this area — have there been break-ins, vandalism, or insurance claims at this property in the last 3 years? What carrier currently insures it and at what premium?
- The area grade is low — what's the realistic commute time and amenity access for the typical tenant pool here? Any planned neighborhood developments (good or bad) we should know about?
- What's the average days-on-market for RENTAL listings here right now (not sales)? A rising rental-DOM trend means longer vacancies and softer asking-rent achievability than the comps imply.
- What's the recent tenant-quality profile in this submarket — average credit score on applications, eviction rate, late-payment / NSF rate, and stable-employment percentage? A property-management company in the area should have these aggregated.
- How much new for-sale + rental construction is in the pipeline within 1–3 miles? Heavy new supply typically softens prices + rents 12–24 months out; constrained supply supports both.
CashFlowRE · CFR-GQMZXY4CT0AVVR
· Data 22 h ago
cashflowre.app · 2026-05-29